 WE-Launch
4 Most Essential Indicators in Technical Analysis

Key takeaways:
- TA tools analyze price movements to spot patterns and trading opportunities.
- Among the many TA indicators available, some of the popular choices include RSI, moving averages, MACD, StochRSI, and Bollinger Bands.
- Combine TA with fundamental analysis for more reliable signals.
What is a technical indicator?
A technical indicator is a tool that uses previous data to estimate future price movements of a stock. During technical analysis, traders utilize a variety of technical indicators to forecast future prices, anticipate price fluctuations, and determine stock movement. Technical indications are classified as either lagging or leading.
Why Use Technical Analysis Indicators?
Technical indicators help traders analyze price movements more effectively. By applying these mathematical calculations to market data, traders can better identify trends and potential trading opportunities.
Various indicator types serve different trading styles and timeframes. While retail traders often use standard indicators, institutional traders and quants frequently develop proprietary indicators tailored to their strategies.
This guide explores essential technical indicators that every trader should understand. We'll examine their calculations, applications, and how to incorporate them into a comprehensive trading approach.
Source:StockGro
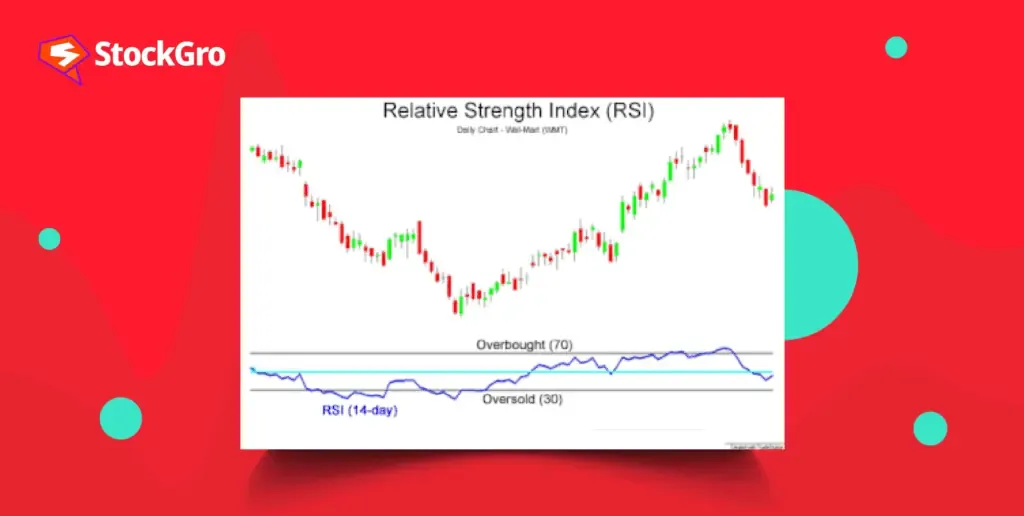
The relative strength index (RSI) may serve as both a leading and trailing indicator. In its most basic form, it is a lagging indicator since the price must move before the indicator can begin moving in that direction. It essentially follows the price, with a tiny delay. RSI identifies market momentum using historical and present data by indicating worry factors about a specific stock. It can determine if a stock is oversold or overbought.
When you are new to markets and are unsure of the stock’s momentum, RSI can help you determine the stock’s position in the market.When using RSI, keep in mind that RSI signals vary from 0 to 100, with 100 indicating overbought and 0 indicating oversold. For example, if the RSI of a stock price is greater than 50, it is assumed that more traders are commencing purchasing for the stock. On the other side, if the stock’s RSI falls below 50, it indicates that traders are selling the shares.
Source:ThinkMarkets
MACD (Moving Average Convergence Divergence) is a momentum indicator that illustrates the relationship between two moving averages of an asset’s price. It comprises a MACD line (12-period EMA minus 26-period EMA), a signal line (9-period EMA of the MACD line), and often a histogram depicting the distance between these two lines.
Traders often use the MACD to identify potential trend changes through divergences. For instance, if an asset’s price creates a higher high while the MACD forms a lower high, it signals weakening momentum despite rising prices, suggesting a potential reversal or pullback. Additionally, crossovers between the MACD line and the signal line can indicate trading opportunities: a MACD line crossing above the signal line might suggest a buy signal, while crossing below could indicate a sell signal.
The MACD is frequently paired with other indicators, like the RSI, to provide a more comprehensive market analysis. While both measure momentum, they do so differently, offering a more robust technical outlook when used in conjunction. For a deeper dive into the MACD, refer to our dedicated article.
Source:Sahm
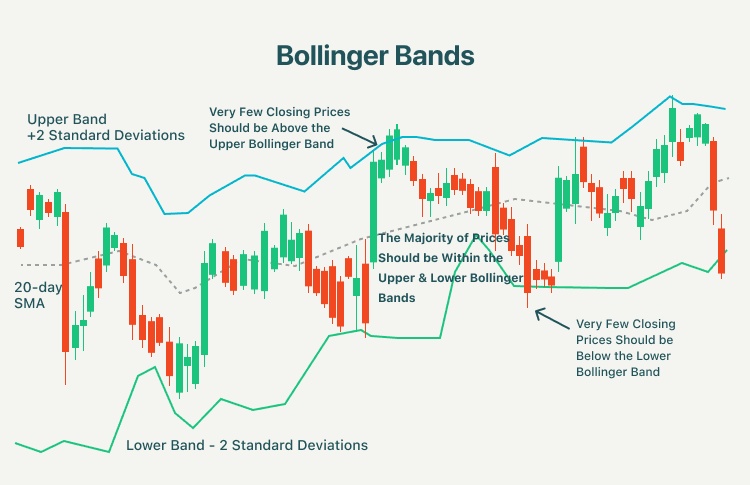
A Bollinger band indicator is used to construct a bandwidth of the stock in which it typically trades.It is a lagging indicator since it relies on 20-day simple moving averages. Volatility is determined by the range of bands formed using Bollinger bands for a stock.
This indicator predicts the price’s continued movement inside the Bollinger band boundaries. The parameters’ standard deviation levels are shown above and below a price-based simple moving average.A technical indicator is particularly beneficial for traders who trade options, futures, or stocks since it provides an instant indication of price movement. Bollinger bands employ a 20-day moving average to determine the upper and lower deviations in a stock.
Moving Average (MA)

Source:ThinkMarkets
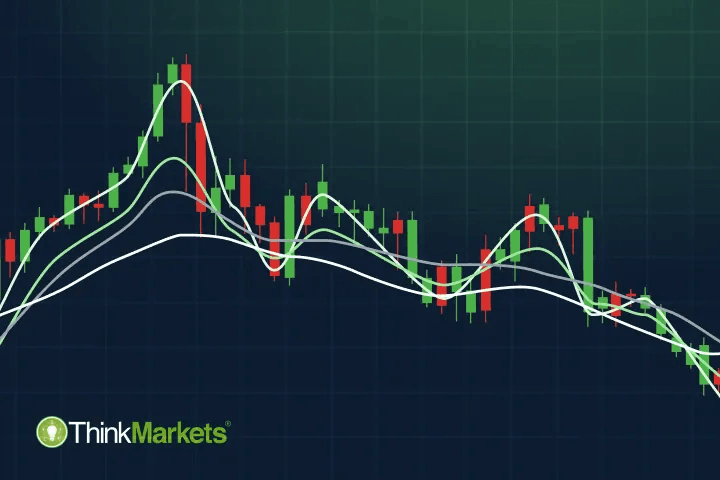
Moving averages are fundamental technical indicators used to smooth price data and identify market trends. As they are based on past prices, they are considered lagging indicators. The two primary types are the Simple Moving Average (SMA), which calculates a basic average over a set period, and the Exponential Moving Average (EMA), which gives more weight to recent price data, making it more responsive. Longer moving averages, such as the 200-day SMA, exhibit greater lag and react slower to price changes compared to shorter ones like the 50-day SMA.
Traders utilize moving averages to gauge trends, often considering an asset in a bull market if its price consistently stays above a long-term moving average like the 200-day SMA. Moving average crossovers also serve as trading signals; for instance, a shorter-term moving average crossing below a longer-term one (e.g., 100-day SMA below 200-day SMA) can signal a potential sell opportunity, indicating that recent price momentum is weakening relative to the longer-term trend and a reversal might be imminent.
Conclusion
Even though indicators show data, it’s important to consider that the interpretation of that data is very much subjective. As such, it’s always useful to step back and consider if personal biases are affecting your decision-making. What may be a direct buy or sell signal for one trader might just be market noise for another.
As with most market analysis techniques, indicators are at their best when used in combination with each other or with other methods, such as fundamental analysis (FA). The best way to learn technical analysis (TA) is through a lot of practice.
Gainers
Customer Support:@weikecs
Business Cooperation:@weikecs
Quant Trading & MM:bd@weex.com
VIP Services:support@weex.com