 WE-Launch
Hammer Candlestick: What it is and how to use it?

Navigating the cryptocurrency market can be challenging, but technical analysis tools like candlestick charts can help traders spot patterns and refine their strategies. These charts are useful not just in crypto, but also in stocks, forex, and other markets.
One key pattern to recognize is the hammer candlestick. This guide explains what it looks like and its significance in trading.
What is the Hammer Candlestick Pattern?
The hammer candlestick pattern is a popular bullish reversal signal used across various financial markets. Traders favor it because it suggests a potential upward trend reversal. For better accuracy, it's often combined with other technical indicators to confirm the trend change.
What does the Hammer Pattern Look Like?
The hammer pattern is easily recognizable on candlestick charts. It consists of a single candle with:
- A small real body (either bullish or bearish)
- A long lower wick (at least twice the body's length)
The pattern's reliability increases with the wick length – the longer the lower shadow, the stronger the potential bullish reversal signal.
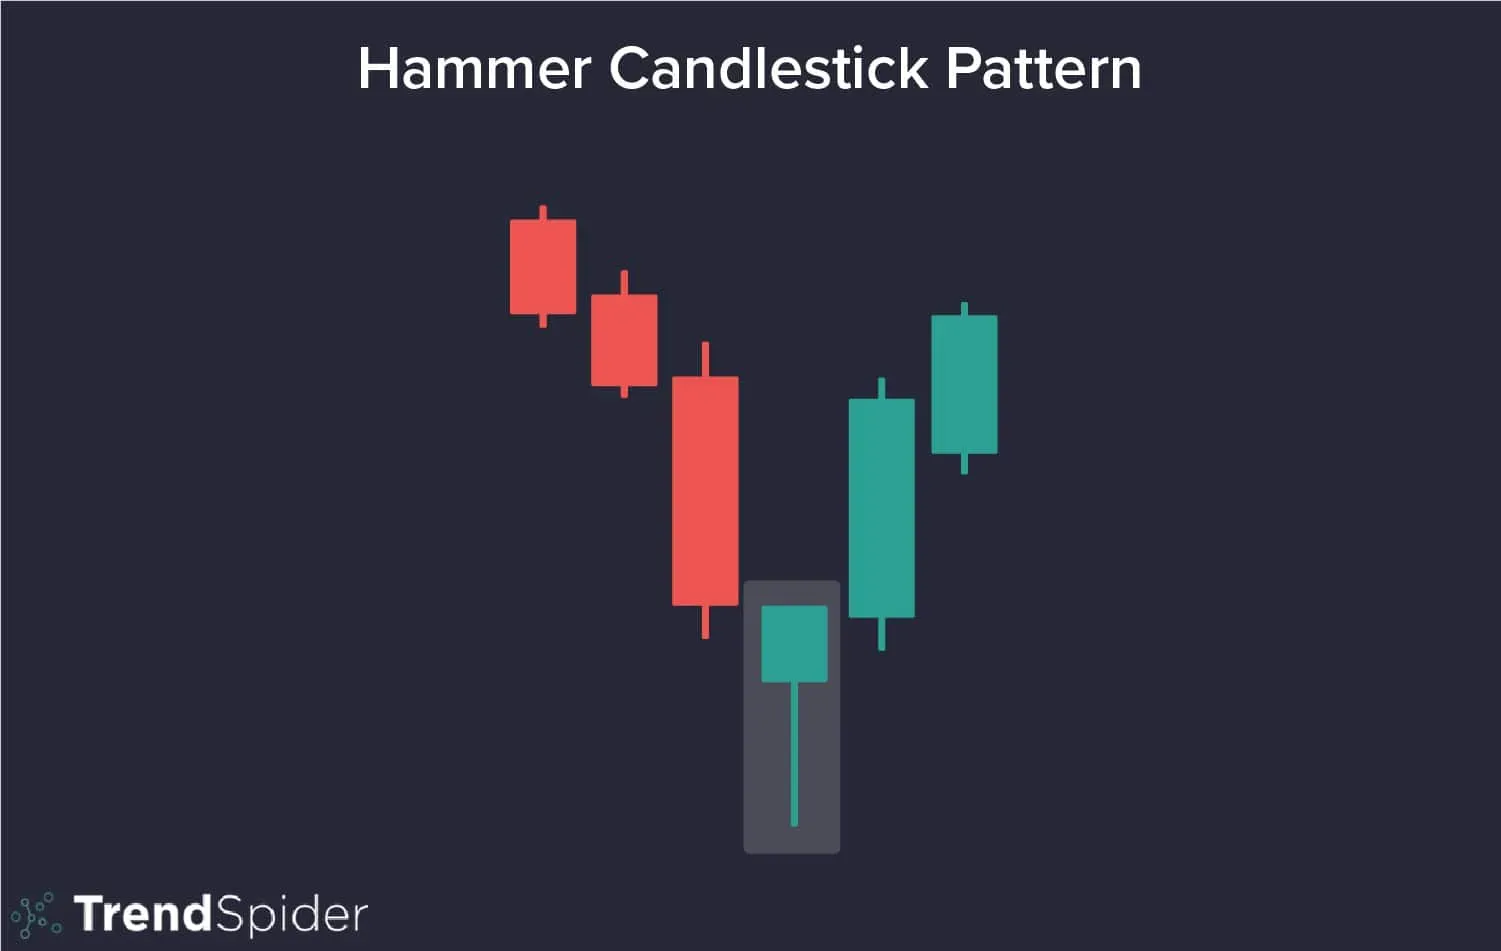
Source: TrendSpider
How to Trade with the Hammer Pattern?
When you identify a hammer pattern, follow these key steps:
- Confirm the signal - Never trade based solely on the hammer. Always validate it with:
- Additional technical indicators (e.g., RSI, moving averages)
- Support/resistance levels
- Volume analysis (increasing volume strengthens the signal)
- Consider market context - Check if the hammer forms:
- After a clear downtrend (for reversal validity)
- Near significant support levels
- Fundamental alignment - Verify if any news/events support the potential reversal
- Risk management - Place stops below the hammer's low and take profits at logical resistance levels
Remember: The hammer suggests potential bullish reversal, but always requires confirmation for higher-probability trades.
Why Remember the Hammer Candlestick Pattern?
While the hammer pattern serves as a reliable bullish reversal indicator across financial markets, traders must acknowledge its inherent limitations. The pattern's primary weakness lies in its susceptibility to false signals, as external market forces can invalidate the anticipated trend reversal despite the hammer's formation. Nevertheless, its distinct visual characteristics make it one of the most recognizable and frequently occurring patterns in technical analysis.
However, the hammer candlesticks are easy to spot, and show up relatively often. The only thing to remember is to wait to act on it, as you should always confirm the trend via other indicators. This is the risk that comes with trading cryptocurrencies. Their volatility makes it difficult to navigate the market, and participants must always be vigilant and cautious.
Gainers
Customer Support:@weikecs
Business Cooperation:@weikecs
Quant Trading & MM:bd@weex.com
VIP Services:support@weex.com