- Buy Crypto
- Markets
- Futures
- Spot
- Copy Trade
 WE-Launch
 Please be informed that the original content is in English. Some of our translated content may be generated using automated tools which may not be fully accurate. In case of any discrepancies, the English version shall prevail.
How to Read the Most Popular Candlestick Patterns?
Key takeaways:
- As a cornerstone of technical analysis, candlestick charts effectively reveal potential entry and exit points across financial markets.
- Classic formations like the Hammer, Hanging Man, and Shooting Star serve as critical indicators for spotting trend reversals or validating ongoing trends.
It’s also important to consider other factors, such as trading volume, market sentiment, and liquidity, when making trading decisions
What are candlesticks?
Candlesticks are a fundamental component of technical analysis used in financial markets to visualize price movements over specific timeframes. They are a popular way to display the opening, closing, high, and low prices of a financial asset (like a stock, cryptocurrency, or commodity) within a single bar.
Think of them as a more informative and visually intuitive way to see what happened to a price than just a simple line graph.
How do candlestick charts work?
Candlestick charts work by visually representing price action over specific timeframes, allowing traders and analysts to quickly grasp market sentiment, volatility, and potential future movements. They are essentially a time-series plot where each data point (a single candlestick) summarizes the open, high, low, and close (OHLC) prices for a given period.
How to read candlestick patterns?
Candlestick patterns emerge from specific sequences of price movements, each offering unique insights into market dynamics. These formations can reveal shifts in supply and demand, signal potential trend reversals or continuations, or reflect periods of market indecision.
However, it's crucial to recognize that candlestick patterns alone do not constitute direct trading signals. Rather, they serve as a powerful lens through which traders can interpret price action and evolving market trends. Their true value emerges when analyzed within the broader market context.
Now, here are some typical candlestick patterns that may help a lot.
Bullish Candlestick Pattern
Hammer
A hammer is a bullish reversal candlestick pattern that forms at the bottom of a downtrend. It has a small body and a long lower wick, which should be at least twice the length of the body.
This pattern indicates that sellers pushed the price lower, but buyers (bulls) aggressively stepped in, driving the price back up near the opening level. While a hammer can be either red (bearish) or green (bullish), a green hammer typically signals stronger buying pressure and a higher chance of a reversal.
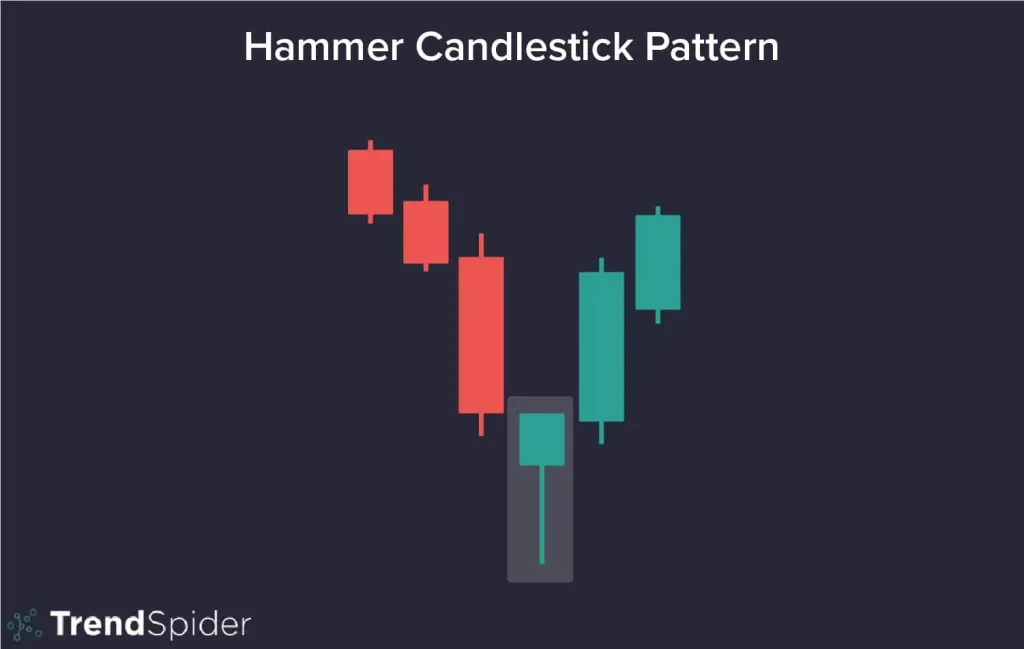
Source:TrendSpider
Three White Soldiers
The Three White Soldiers is a strong bullish reversal pattern consisting of three consecutive green (bullish) candlesticks, each opening within the body of the previous candle and closing above the prior candle’s high.
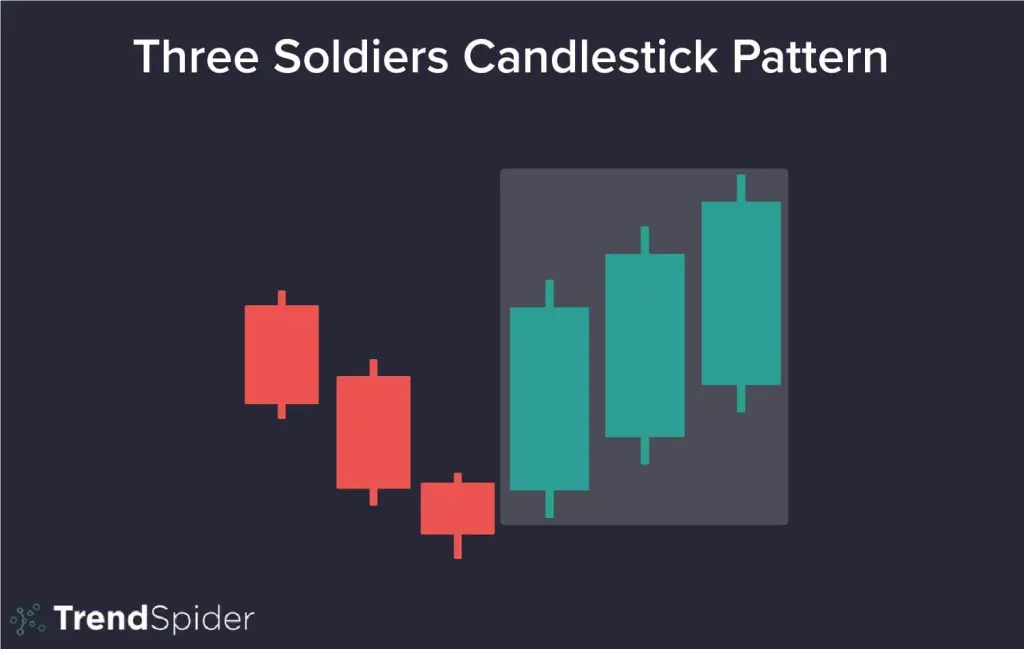
Source:TrendSpider
Bearish Candlestick Pattern
Shooting Star
The Shooting Star is a bearish reversal candlestick pattern that forms at the top of an uptrend.
The pattern suggests bulls lost control after testing highs, potentially indicating trend exhaustion. Volume analysis can strengthen its predictive power - higher volume during formation typically increases reversal likelihood.
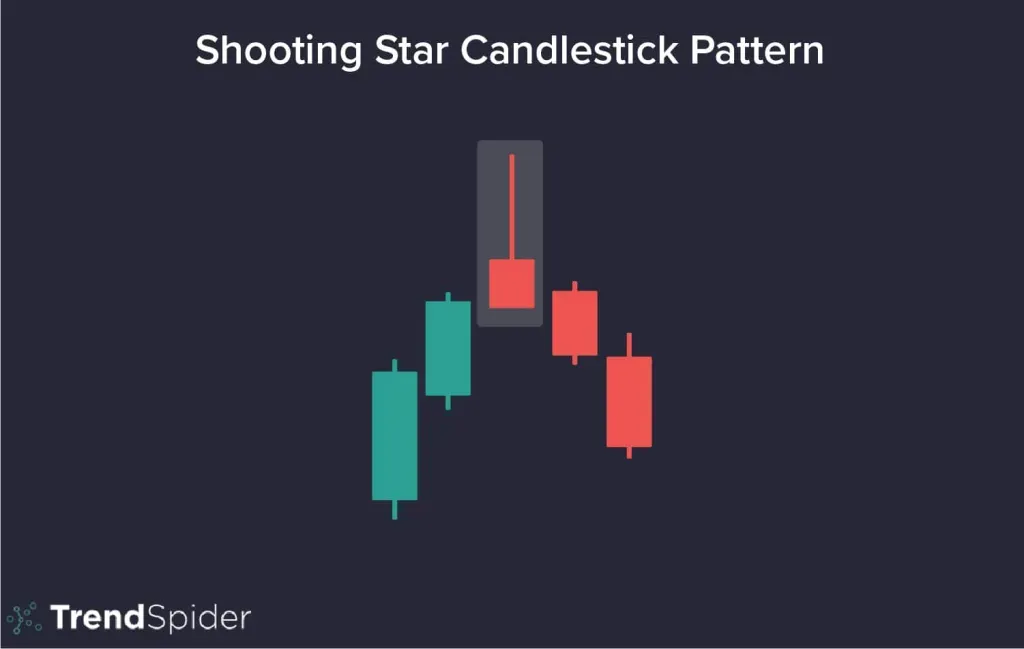
Source:TrendSpider
Hanging Man
The hanging man is the bearish equivalent of a hammer. It usually appears at the end of an uptrend, featuring a small body and a long lower wick.
The long lower wick suggests that a strong sell-off occurred following the uptrend, though buyers temporarily regained control and pushed the price higher. This marks a moment of uncertainty, where buyers attempt to sustain the uptrend while increasing selling pressure emerges.
When the hanging man forms after a prolonged uptrend, it can serve as a warning that bullish momentum may be weakening, indicating a possible reversal to the downside.
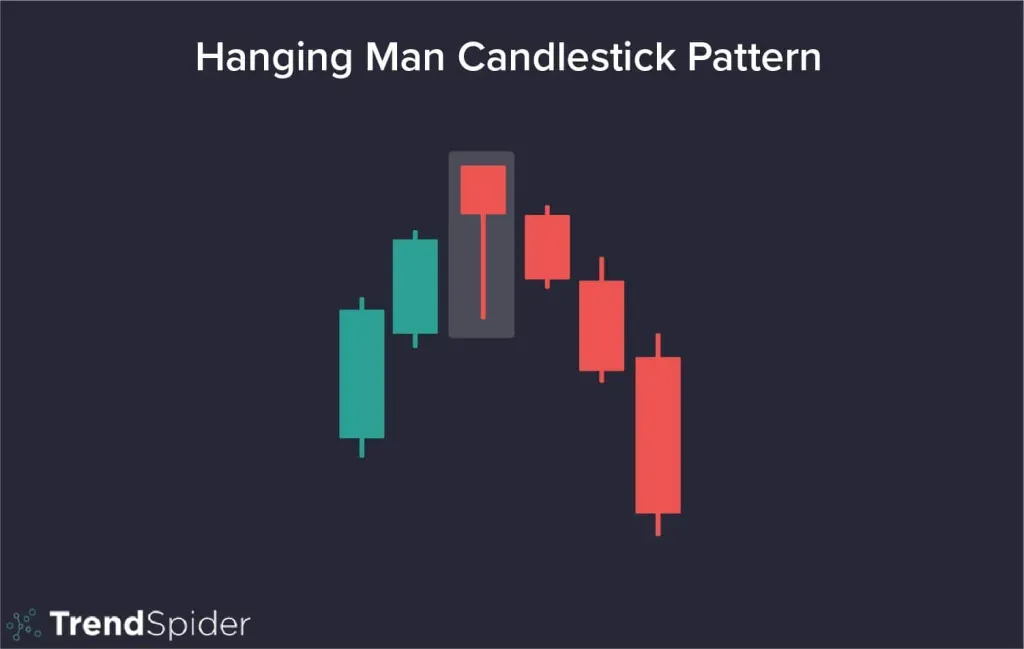
Source:TrendSpider
How to use candlestick patterns in crypto trading?
Traders should keep the following tips in mind when using candlestick patterns in crypto trading:
Understand the basics
Crypto traders should have a solid understanding of the basics of candlestick patterns before using them to make trading decisions. Never risk capital on patterns you haven't thoroughly backtested. In crypto's 24/7 markets, the price of inadequate preparation is measured in lost assets, not just lost opportunities.
Combine various indicators
Candlestick patterns become significantly more powerful when combined with other technical analysis tools. The most successful traders don't rely on single indicators, but rather look for confluence - when candlestick patterns align with multiple technical signals.
Use multiple timeframes
Crypto traders should examine candlestick patterns across multiple timeframes—such as daily, hourly, and 15-minute charts—to better gauge market sentiment.
Practice risk management
Like any trading strategy, candlestick patterns carry risks, necessitating risk management techniques such as stop-loss orders, avoiding overtrading, and ensuring a favorable risk-reward ratio to protect capital.
Conclusion
Every trader can benefit from understanding candlestick patterns and their signals, even if they don’t actively use them in their strategy.
While these patterns can be valuable for market analysis, it’s crucial to remember that they aren’t foolproof. They serve as useful indicators, reflecting the buying and selling pressures that shape market movements. Still, they should always be combined with other tools and proper risk management to minimize potential losses.
You may also like
Gainers
Customer Support:@weikecs
Business Cooperation:@weikecs
Quant Trading & MM:bd@weex.com
VIP Services:support@weex.com