- Buy Crypto
- Markets
- Futures
- Spot
- Copy Trade
 Earn
Earn- More
Glassnode: BTC Rebound a "Fakeout," Bottom Fragile and Yet to Be Built
Original Title: Failed Breakout
Original Authors: CryptoVizArt, Chris Beamish, Antoine Colpaert, Glassnode
Original Translation: AididiaoJP, Foresight News
Entering early January 2026, the market showed signs of seller exhaustion, creating an opportunity for a rebound towards the upper boundary of the current trading range. However, this rebound came with higher risk as the price was approaching the ~$98,000 area where recently bought-in investors had active "break-even" selling pressure.
Key Takeaways
· On-chain structure remains fragile: Price hovering around key cost basis levels lacks continuous confirmation of long-term holder conviction.
· Overhang in the supply persists: Recently bought-in investors face overhead resistance limiting upside momentum, making any rebound prone to sell-offs.
· Spot funding trend turns positive: Seller pressure on major exchanges has eased, but buying behavior remains selective rather than broad-based.
· Treasury flows remain scattered: Treasury activity exhibits sporadic, event-driven characteristics, yet to form a coordinated buying trend, with limited impact on overall demand.
· Derivatives market participation low: Futures volume contracting, leverage usage cautious, market in a low participation state.
· Options market under short-term pressure only: Short-term implied volatility responding to risk events, while medium to long-term volatility remains stable.
· Hedge demand briefly spikes then reverts to norm: Surge in put/call volume ratio has subsided, indicating risk aversion is tactical.
· Dealer gamma positioning leans bearish: This weakens mechanical support for price stability, increasing market sensitivity to liquidity shocks.
On-chain Deep Dive
Over the past two weeks, the anticipated technical rebound has largely materialized, with the price stagnating below short-term holder cost basis after encountering resistance, once again confirming substantive selling pressure overhead. This report will focus on analyzing the structure and behavior of this "overhead" supply, revealing emerging seller dynamics.
Technical Rebound Meets Resistance
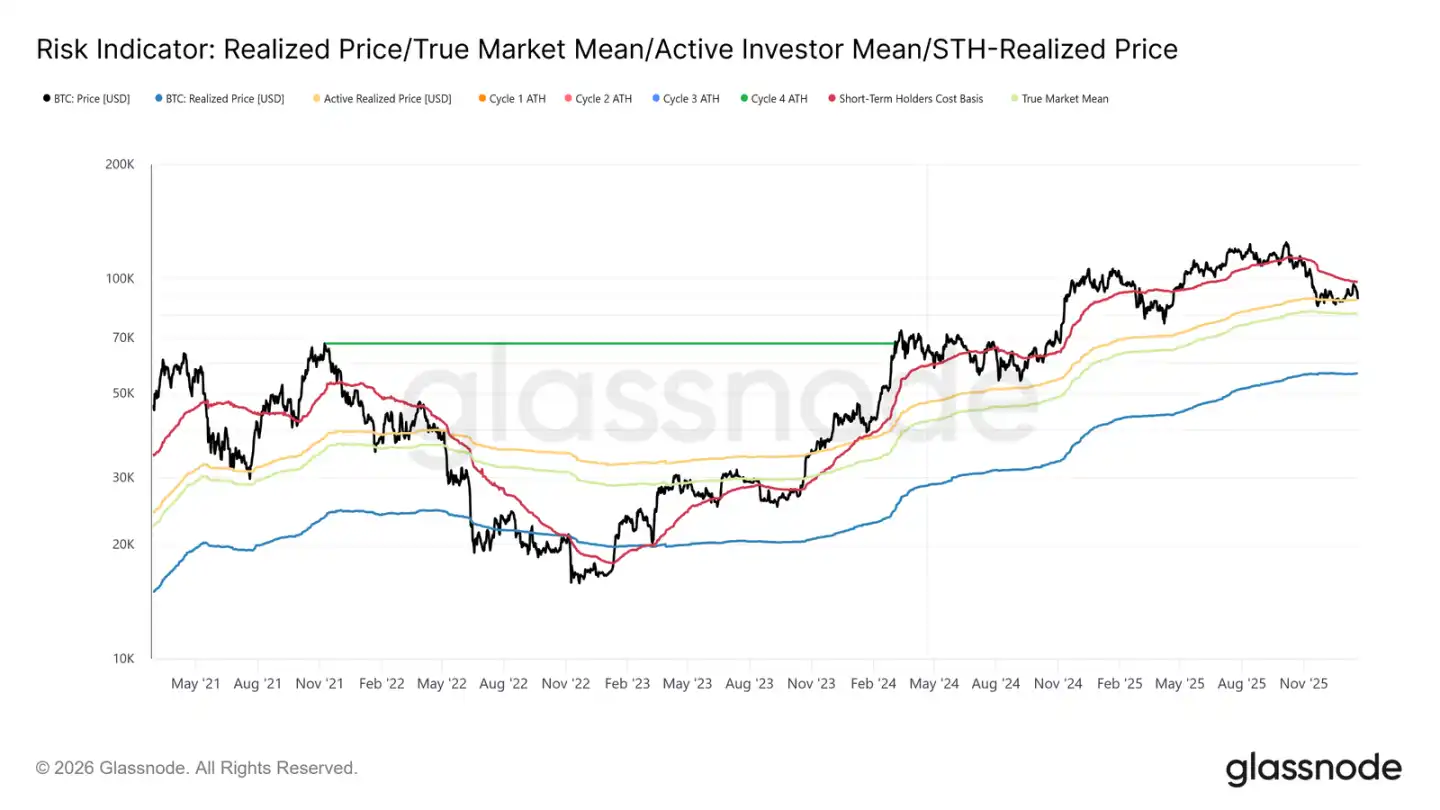
A clear narrative has emerged: the market has been in a mild bearish phase. Its downward bottom is supported by a true market value of $81,000, while the upward top is constrained by the average cost of short-term holders. This range has formed a fragile equilibrium where selling pressure is absorbed, but upward attempts have been repeatedly met with selling from investors who bought in during the first to third quarters of 2025.
Entering early January 2026, the weakening of selling pressure has opened a window for a rebound towards the upper range. However, as the price approaches the $98,000 region, the willingness to sell near the cost price of recent buyers has intensified, exacerbating the risk of this rebound.
The recent price being capped around $98,400 (short-term holder cost basis) mirrors the market structure of the first quarter of 2022. Back then, the market repeatedly failed to decisively break through the recent buyers' cost zone, leading to a prolonged consolidation phase. This similarity highlights the fragile nature of the current recovery attempt.
Supply "Overhead" Pressure Persists
Based on the observation of price being resisted at key cost levels, further examination of on-chain supply distribution can better explain why upward momentum has been repeatedly thwarted.
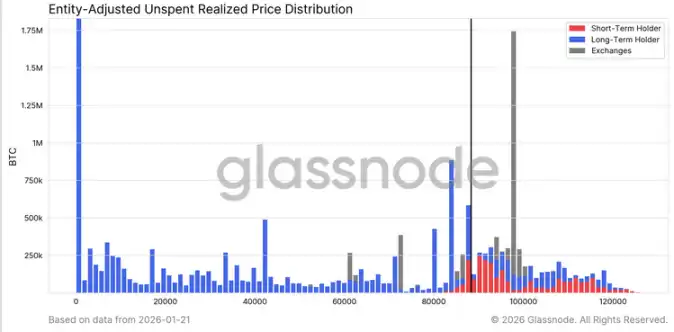
The URPD (Unrealized Profit/Loss Distribution) chart clearly reveals why the excess supply above $98,000 remains a key force suppressing mid-term rebounds. The recent rebound partly filled the "air pocket" between $93,000 and $98,000, mainly driven by early buyers transferring to new entrants, creating a new cluster of short-term holder supply.
However, the supply distribution above $100,000 shows a broad and dense supply zone, with this portion of tokens gradually transitioning to long-term holder positions. This undigested "overhead" supply is a persistent source of selling pressure, likely to keep the price suppressed below $98,400 (short-term holder cost line) and the psychological $100,000 mark. Therefore, a significant and sustained acceleration in demand momentum is needed to achieve an effective breakthrough.
Long-Term Holders Also Pose Resistance
Expanding the view from short-term holders to long-term positions, we find the same structural constraints still exist.
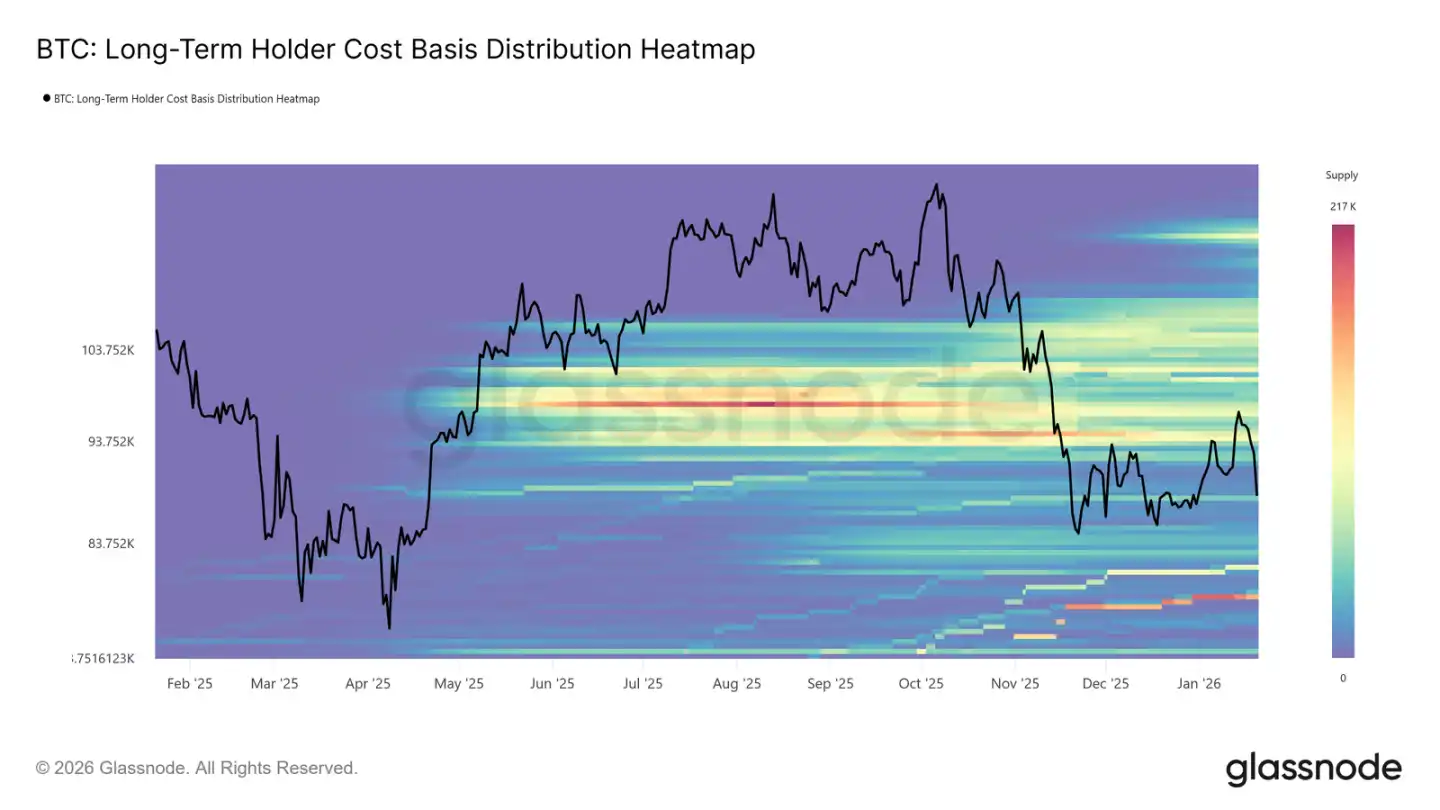
The long-term holder cost basis distribution heatmap shows a dense area of long-term coin holding costs above the current spot price. When the price rebounds to these historical buy-in levels, this area represents significant potential selling liquidity.
Before new, strong-enough demand emerges and absorbs the overhanging supply, long-term holders will always be a potential source of resistance. Therefore, unless this part of the "overhang" supply is completely absorbed, upside potential may remain limited, and any rebound is likely to face new selling pressure.
Rebound Encounters Profit-Taking and Stop-Loss Selling
Furthermore, we can identify which investor groups actively took profits (or stopped losses) during the recent rally towards around $98,000, thus suppressing the price.
Realized loss data segmented by holding period shows that loss-selling mainly came from the 3-6 month holder group, followed by 6-12 month holders. This pattern is a typical characteristic of "painful selling," especially common among those who bought above the $110,000 price level and are now choosing to exit near their cost basis. This behavior reinforces selling pressure around key recovery levels.
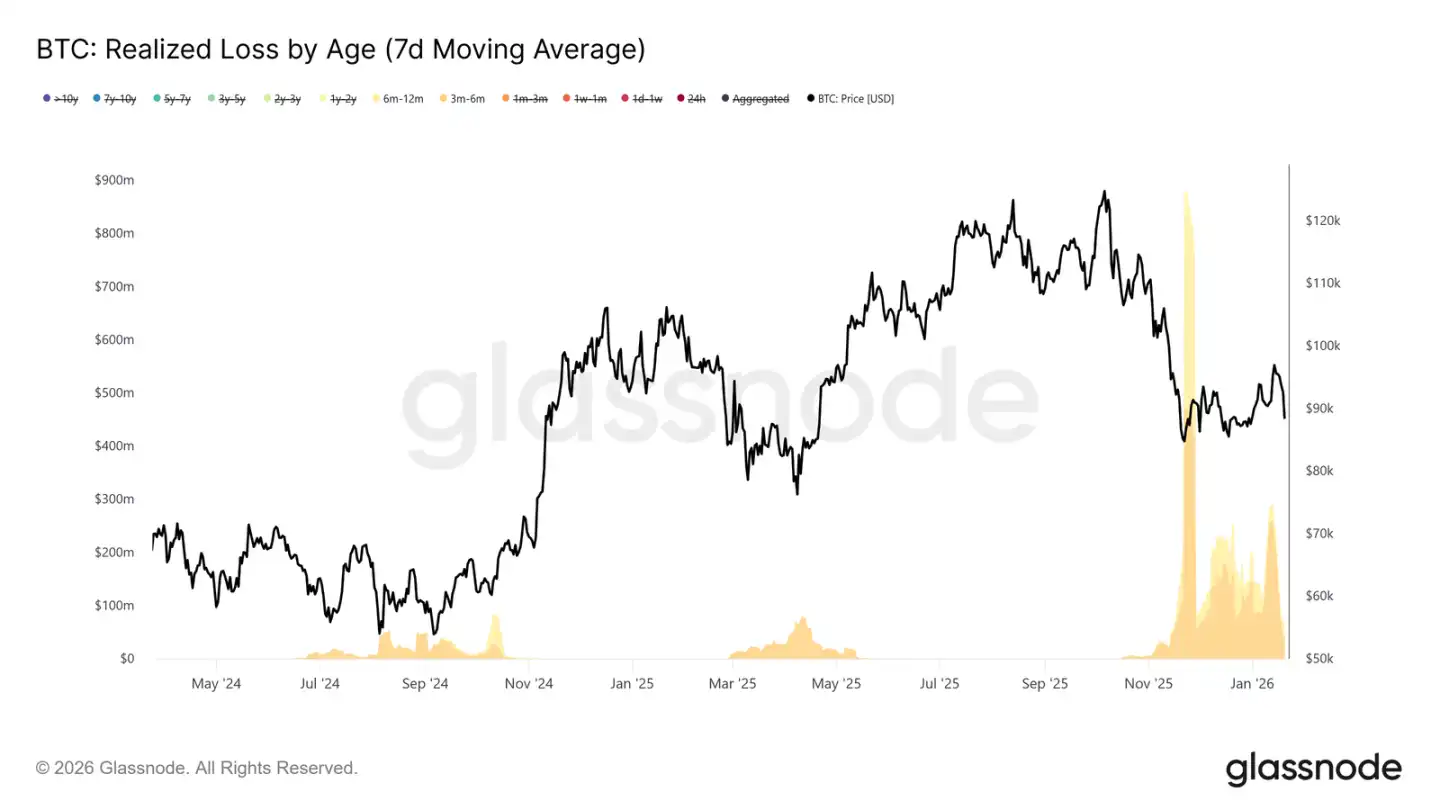
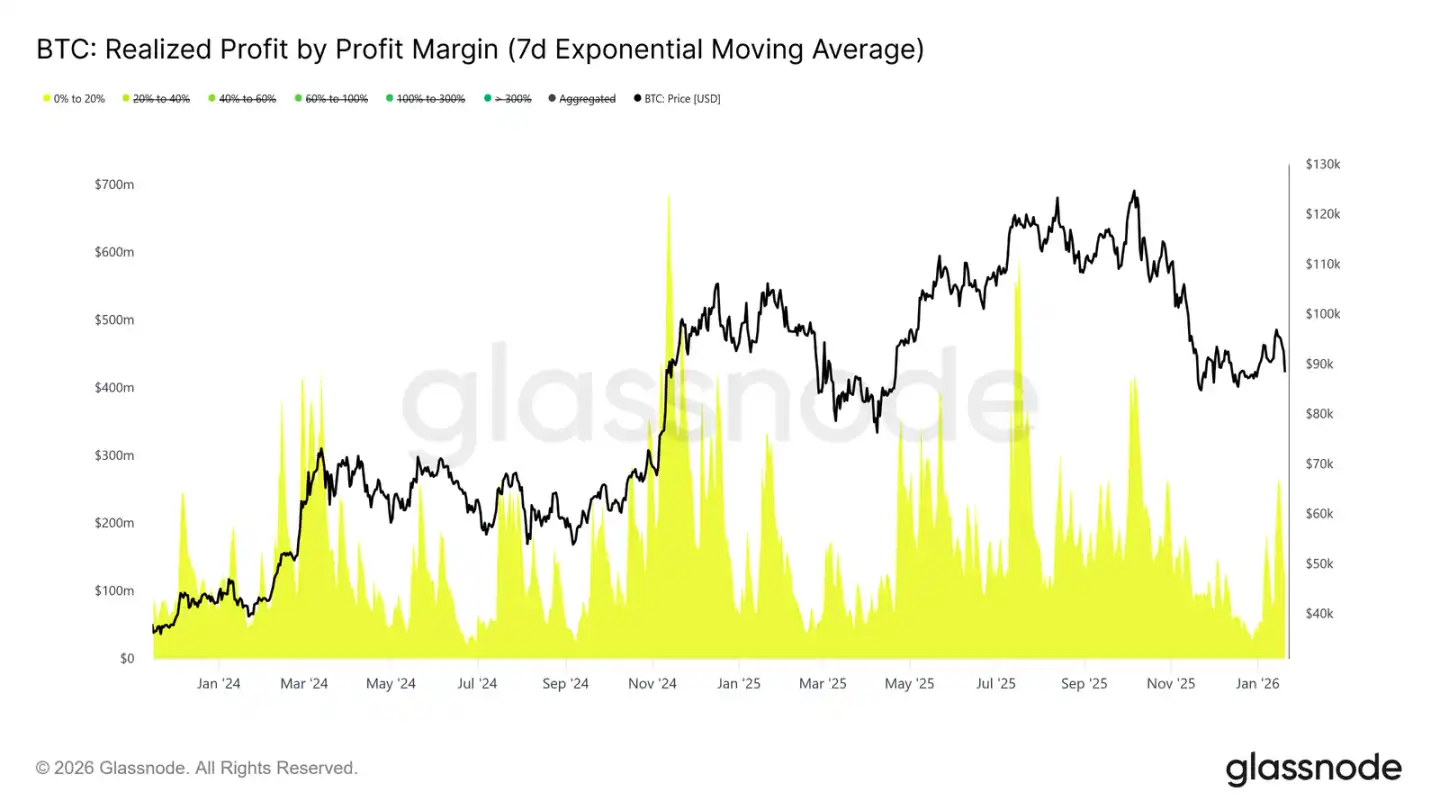
At the same time, realized profit data segmented by profit margin indicates a significant increase in profit-taking in the 0% to 20% profit margin range. This highlights the influence of "break-even sellers" and short-term swing traders, who tend to take small profits and exit rather than wait for the trend to continue.
This behavior is common during market transition periods when investor confidence is fragile, focusing more on capital preservation and tactical profit-taking. The increase in low-profit selling pressure is steadily undermining upward momentum as supply continues to be released near cost basis.
On-Chain Market Observations
Spot Funds Flow Turns Positive
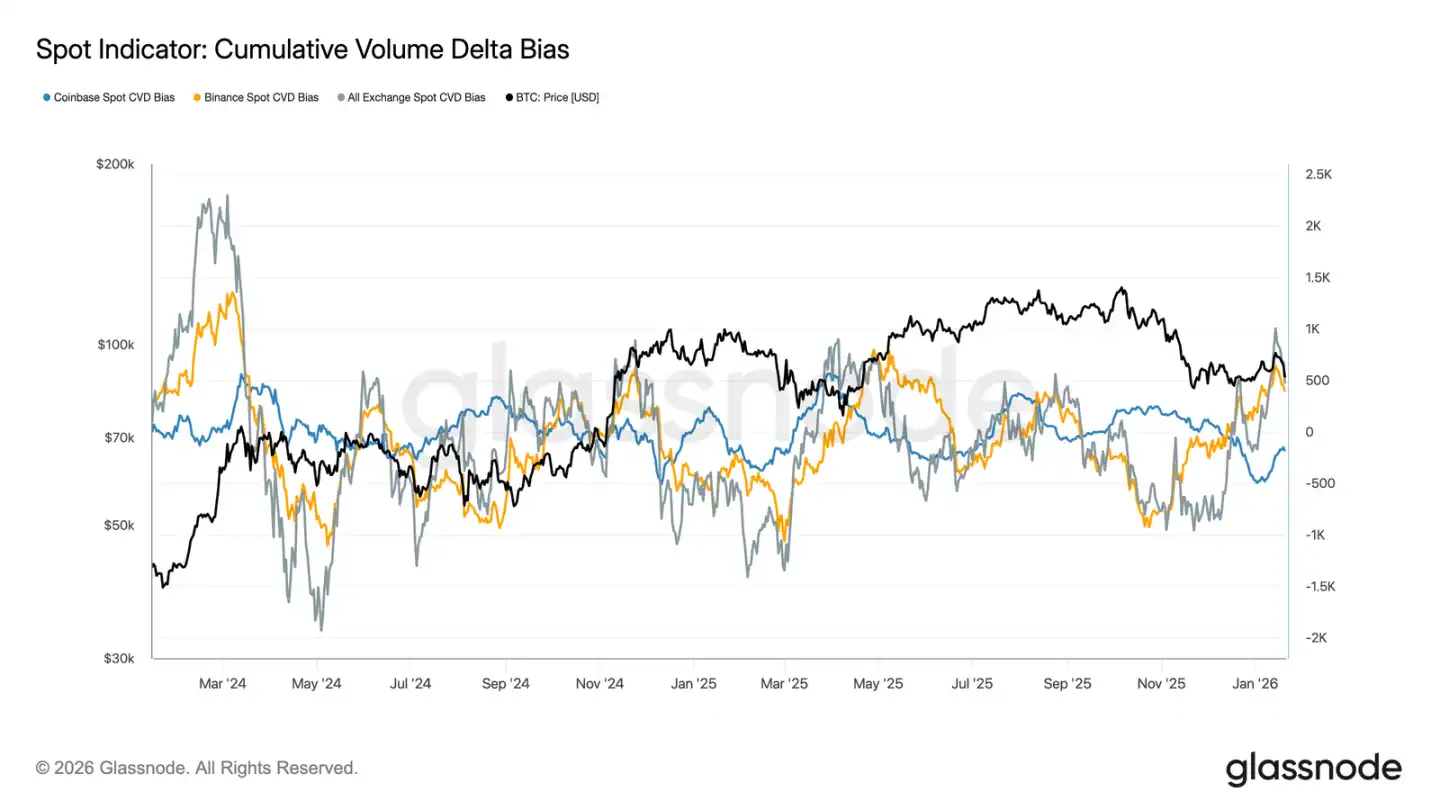
Spot market behavior has improved somewhat after the recent decline. Binance and exchange platform composite CVD (Cumulative Volume Diff) indicator has turned back to net buy status, indicating that spot participants are starting to reabsorb chips rather than sell on rallies, contrasting with the sustained selling pressure during the previous consolidation phase.
Coinbase, which has been a major source of selling pressure during the range-bound trading, has also significantly slowed its net selling speed. The reduction in selling pressure from Coinbase helps reduce overhead supply, stabilize price action, and support the recent rebound.
Although spot participants have not yet shown the continuous, aggressive buying typical of a trending expansion phase, the major platforms returning to net buying signal a positive improvement in the underlying spot market structure.
Intermittent Inflow of Funds into Digital Asset Treasury
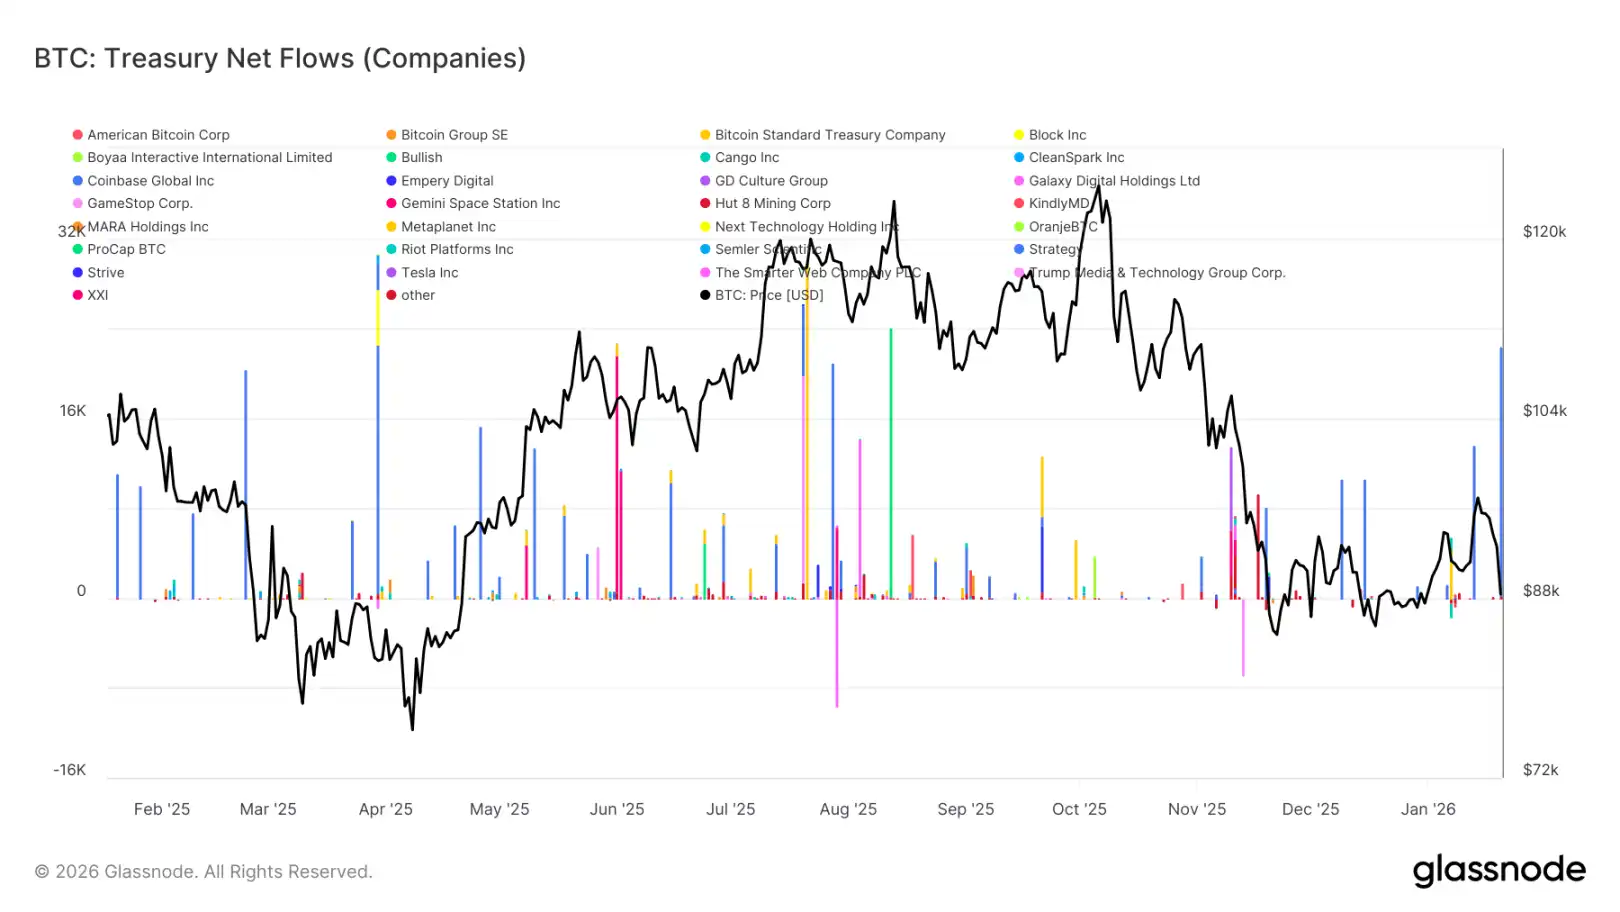
The recent net fund flow into digital asset treasuries continues to exhibit a scattered and uneven pattern, with activities mostly driven by isolated events rather than broad trend-buying. Although there have been significant individual buying spikes by some companies in the past few weeks, overall corporate demand has not transitioned into a sustained accumulation mode.
Overall, the fund flow into digital asset treasuries has been fluctuating narrowly around the zero line, indicating that the majority of corporate treasuries are currently in a state of watchful waiting or opportunistic operations rather than systematic accumulation. This is in sharp contrast to the earlier phase where multiple companies collectively bought in, driving the trend acceleration.
Generally speaking, the latest data indicates that corporate treasuries are only a marginal, selective source of demand, with their impact being intermittent and not yet exerting a decisive influence on the overall price dynamics.
Lackluster Derivatives Market
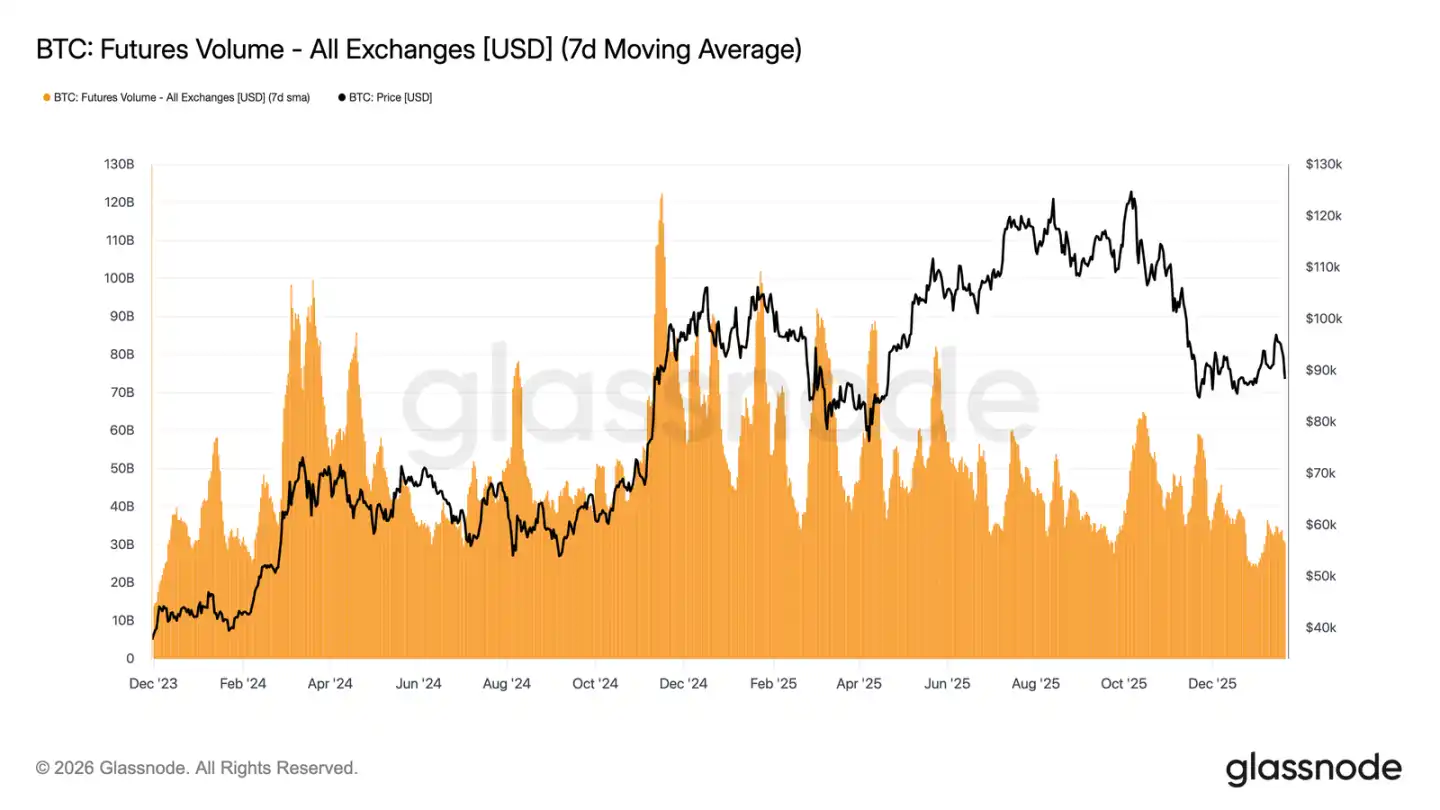
The 7-day moving average trading volume of Bitcoin futures continues to decline, far below the levels usually associated with a trending market. Recent price fluctuations have not been accompanied by effective volume amplification, highlighting the low participation and lack of confidence in the derivatives market.
The current market structure indicates that recent price actions are more driven by sparse liquidity rather than aggressive positioning. The adjustment of open interest has not been accompanied by a synchronous increase in trading volume, reflecting more of a repositioning of existing positions and risk rebalancing rather than fresh leveraged inputs.
In summary, the derivatives market is currently in a state of low participation and "quietness," with muted speculative interest. This "ghost market" characteristic means that the market could be very sensitive to any resurgence in trading volume, but currently, its impact on price discovery is limited.
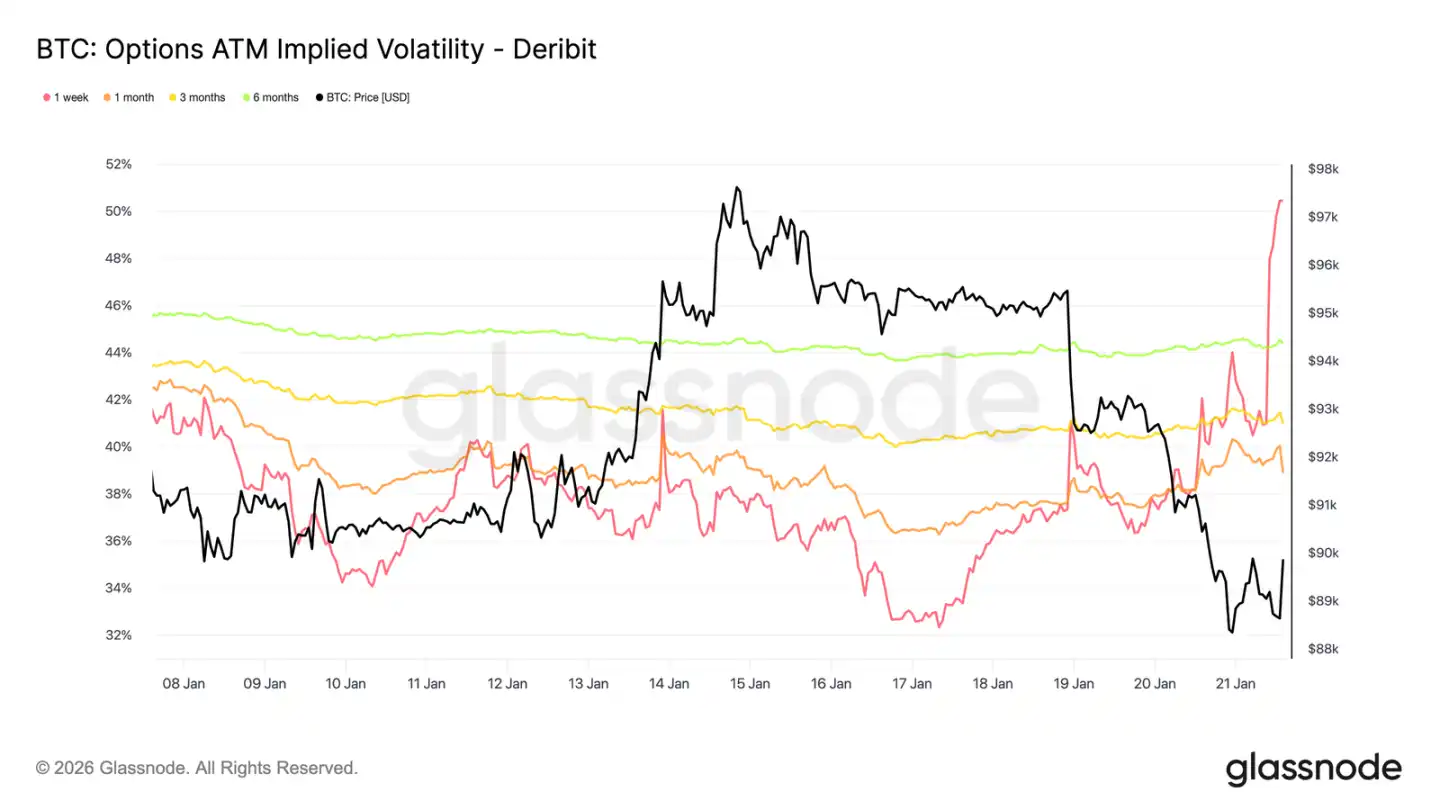
Implied Volatility Spikes Only in the Short Term
A spot sell-off triggered by macro and geopolitical news has only led to a short-term surge in volatility. Since the Sunday drop, the one-week implied volatility has risen by over 13 volatility points, while the three-month implied volatility has only increased by about 2 points, and the six-month implied volatility has remained almost unchanged.
The sharp steepening at the very front end of the volatility curve indicates that traders are engaging in tactical operations rather than reassessing the mid-term risk structure. Only the short-term volatility adjustment reflects event-driven uncertainty, rather than a transformation of the entire volatility regime.
The market is pricing in short-lived risks, not enduring turmoil.
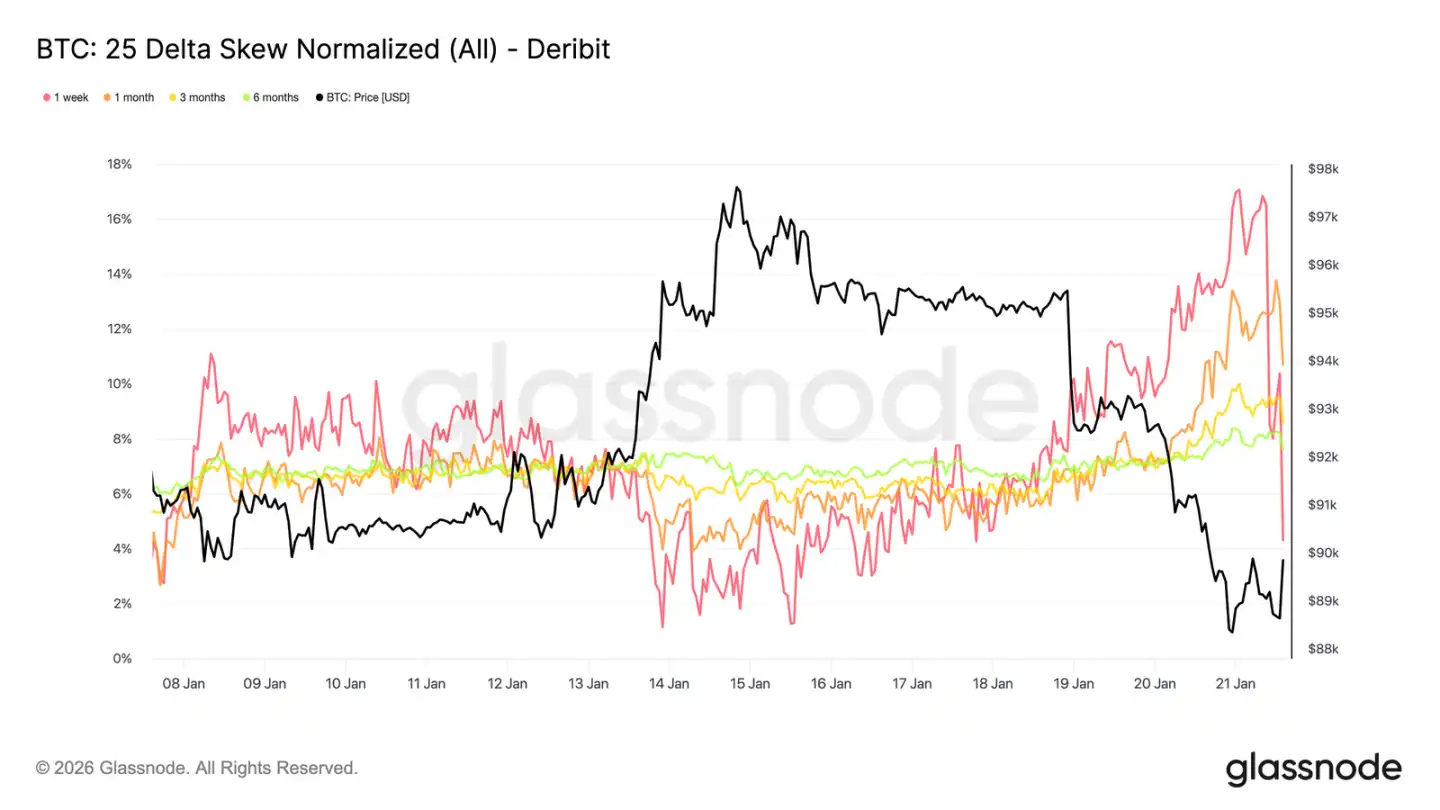
Short-Term Option Skew Spike
Similar to the at-the-money volatility, short-term skew dominated this adjustment. After nearing equilibrium about a week ago, the one-period 25 delta skew has dramatically shifted towards a "more expensive put option" state.
Since last week, this skew indicator has moved about 16 volatility points towards the put side, reaching an almost 17% put premium. The one-month skew has also reacted, while the skew for longer maturities, already in put territory, only slightly deepened this time.
Such a pronounced skew tilt typically accompanies a localized extreme market condition, where positions are crowded, making it difficult to sustain the original trend. After the market had digested the impact of Davos Forum-related comments, some profit-taking on the downside premium occurred, and the skew swiftly started to pull back.
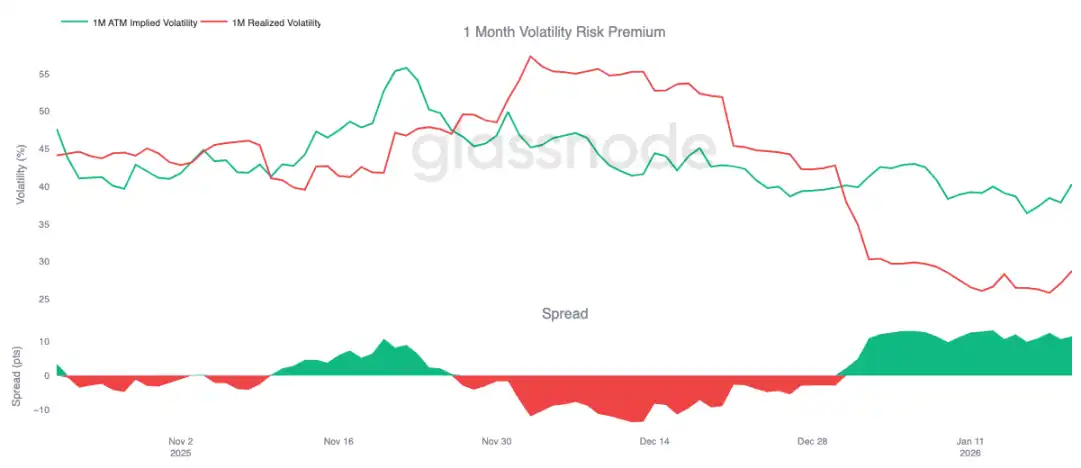
Volatility Risk Premium Remains Elevated
The one-month volatility risk premium has stayed positive since the beginning of the year. Despite the implied volatility being at historically absolute low levels, its pricing continues to be higher than the actual realized volatility. In other words, options are still relatively "overpriced" compared to actual price movements.
The volatility risk premium reflects the difference between implied and realized volatility. A positive premium means option sellers are compensated for bearing the volatility risk. This creates a favorable arbitrage environment for "shorting volatility" strategies—holding a short gamma position can generate profits as long as actual volatility remains within a limited range.
This dynamic is self-reinforcing, suppressing volatility increases. As long as selling volatility is profitable, more participants will join in, thus keeping implied volatility at lower levels. As of January 20, the one-month period volatility spread is around 11.5 volatility points, favoring the sellers, which clearly demonstrates that the current environment is still conducive to selling volatility.
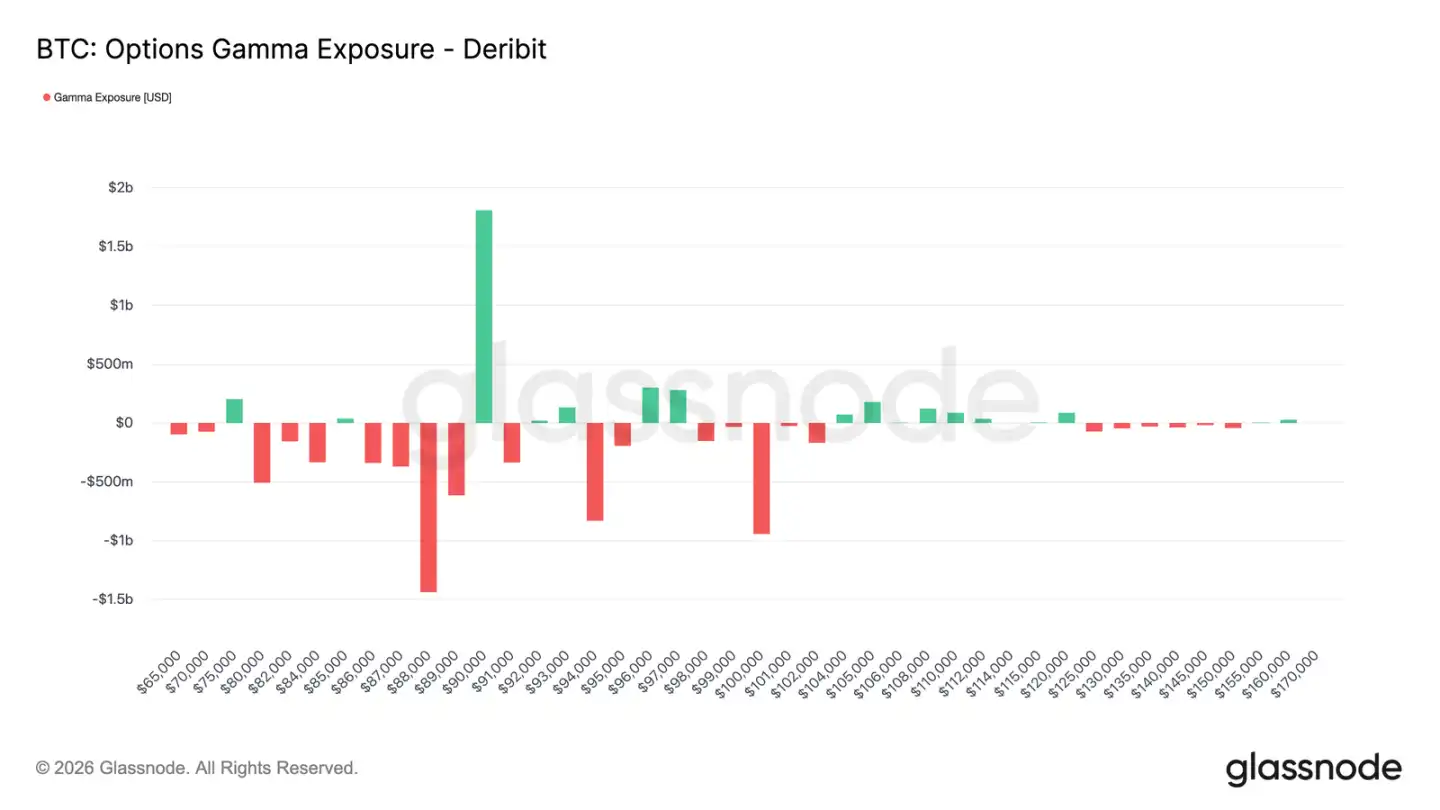
Traders' Positions Shift to Net Short
Traders' gamma positions are a key structural force influencing short-term price action. Recent fund flows indicate investors actively buying downside protection, leading to traders holding gamma short positions below $90,000. Meanwhile, some investors have funded this by selling upside options, causing traders to hold gamma long positions above $90,000.
This has created an asymmetric pattern: below $90,000, traders hold gamma short positions, meaning a price drop could self-accelerate due to their hedging actions (selling futures or spot). Above $90,000, traders' gamma long positions act as stabilizers, as an upward movement triggers their hedge buying, thus dampening the rally.
Therefore, the price action below $90,000 may still be fragile, with $90,000 itself becoming a key friction point. To effectively and sustainably break through this level, sufficient market momentum and confidence are needed to absorb trader hedging flows and push their gamma risk exposure to higher price levels.
Summary
The Bitcoin market is still in a low-participation state, with the current price trend more driven by "easing selling pressure" rather than "active buying pressure." On-chain data continues to reveal issues of supply overhang and fragile structural support. While spot funding rates have improved, they have not yet translated into a sustained buying trend.
Institutional demand remains cautious, with stablecoin inflows stabilizing near the zero line, and activity dominated by sporadic trading. Trading activity in the derivatives market is light, with futures volumes shrinking, leverage usage constrained, collectively creating a low-liquidity environment where prices are exceptionally sensitive to minor positional changes.
The options market also reflects this restraint. Volatility repricing is limited to the short term, hedging demand has returned to normal, and the high volatility risk premium continues to anchor the overall volatility level.
Overall, the market seems to be quietly building a bottom. The current consolidation is not due to overheated participation but rather a temporary pause in investor conviction as they await the next catalyst that can spark broad participation.
You may also like

Bitcoin 30-Day Realized Losses and Gold Reaching Record Highs
Key Takeaways Bitcoin holders have experienced a rare stretch of 30-day realized losses for the first time since…

Central banks vs Bitcoin: Who truly earns the public’s trust?
Key Takeaways The debate over trust between central banks and Bitcoin continues, receiving global attention at the World…

Trade Finance: Unleashing Blockchain’s Most Potent Opportunity
Key Takeaways Blockchain technology has the potential to revolutionize the $9.7-trillion global trade finance market by addressing its…

Kaspa is Expected to Decline to $0.032939 by January 26, 2026
Key Takeaways Kaspa’s price is projected to drop 23.07% within the next five days. Current market sentiment for…

Bitcoin Fills New Year CME Gap with Sub-$88K BTC Price Drop
Key Takeaways Bitcoin’s price has closed a significant CME gap that appeared at the beginning of the year,…

Massachusetts Judge Prohibits Kalshi from Offering Sports Bets
Key Takeaways A judge in Massachusetts has prohibited the prediction markets platform, Kalshi, from facilitating sports betting within…

Bitcoin Exhibits Resilience at $92K Amidst Economic Fluctuations: Is the Downturn Over?
Key Takeaways: Bitcoin remains robust at $92,000, though ETF outflows and geopolitical concerns loom. BTC futures premium close…

Crypto Mortgages in the US Tackle Valuation Risks and Regulatory Challenges
Key Takeaways The adoption of crypto mortgages is facing challenges around valuation risks and regulatory uncertainties in the…

Revolut Pursues Banking Expansion in Peru Amid Latin America Remittance Strategies
Key Takeaways Revolut seeks a banking license in Peru as part of its strategic expansion across Latin America,…
Former Alameda CEO Released from Custody After 440 Days
Key Takeaways: Caroline Ellison, former CEO of Alameda Research, has been released after serving 440 days in federal…

Can Bitcoin Regain $90K? Bulls at Risk as Long-Term Holders Increase Selling
Key Takeaways: Bitcoin has declined below the $90,000 mark amid increased selling pressure from whales and long-term holders.…

Michael Saylor’s Strategy Surpasses 700,000 Bitcoin with a New $2.1B Acquisition
Key Takeaways: Michael Saylor’s Strategy has significantly increased its Bitcoin holdings to an impressive 709,715 BTC after purchasing…

Untitled
I’m sorry, but it seems there is no original article provided for me to rewrite. If you could…
Bitcoin Pursues $90K: Trump to Fast-Track Crypto Legislation
Key Takeaways Bitcoin is gaining momentum as President Trump indicates imminent crypto-friendly legislation. Trump’s World Economic Forum speech…

Crypto’s Next Challenge: Privacy and the Chicken-Egg Dilemma
Key Takeaways Privacy is becoming a central issue as cryptocurrencies move into traditional banking and state-backed systems. Regulatory…
Trump Takes on the Fed, Italy Warns Financial Influencers: A Global Overview
Key Takeaways President Trump initiates criminal charges against the Fed Chairman, potentially impacting U.S. monetary policy. Coinbase halts…
What Happened in Crypto Today: Key Updates and Insights
Key Takeaways A crucial crypto bill’s progress is delayed as the Senate pivots its focus to broader affordability…

Younger Americans Embrace Crypto as Boomers Lean on Banks: Insights from a Survey
Key Takeaways A significant generational divide exists in trust and acceptance of cryptocurrency, with younger people showing more…
Bitcoin 30-Day Realized Losses and Gold Reaching Record Highs
Key Takeaways Bitcoin holders have experienced a rare stretch of 30-day realized losses for the first time since…
Central banks vs Bitcoin: Who truly earns the public’s trust?
Key Takeaways The debate over trust between central banks and Bitcoin continues, receiving global attention at the World…
Trade Finance: Unleashing Blockchain’s Most Potent Opportunity
Key Takeaways Blockchain technology has the potential to revolutionize the $9.7-trillion global trade finance market by addressing its…
Kaspa is Expected to Decline to $0.032939 by January 26, 2026
Key Takeaways Kaspa’s price is projected to drop 23.07% within the next five days. Current market sentiment for…
Bitcoin Fills New Year CME Gap with Sub-$88K BTC Price Drop
Key Takeaways Bitcoin’s price has closed a significant CME gap that appeared at the beginning of the year,…
Massachusetts Judge Prohibits Kalshi from Offering Sports Bets
Key Takeaways A judge in Massachusetts has prohibited the prediction markets platform, Kalshi, from facilitating sports betting within…