- Buy Crypto
- Markets
- Futures
- Spot
- Copy Trade
 WE-Launch
Historical B/S Indicators for Candlestick Charts
WEEX just got smarter! Review past trades and refine your strategies with our brand-new feature: Historical B/S (Buy/Sell) markers for candlestick charts! Now, you can view your past trades right on the chart, helping you make sharper decisions and trade more efficiently.
Highlights
- Trade records at a glance
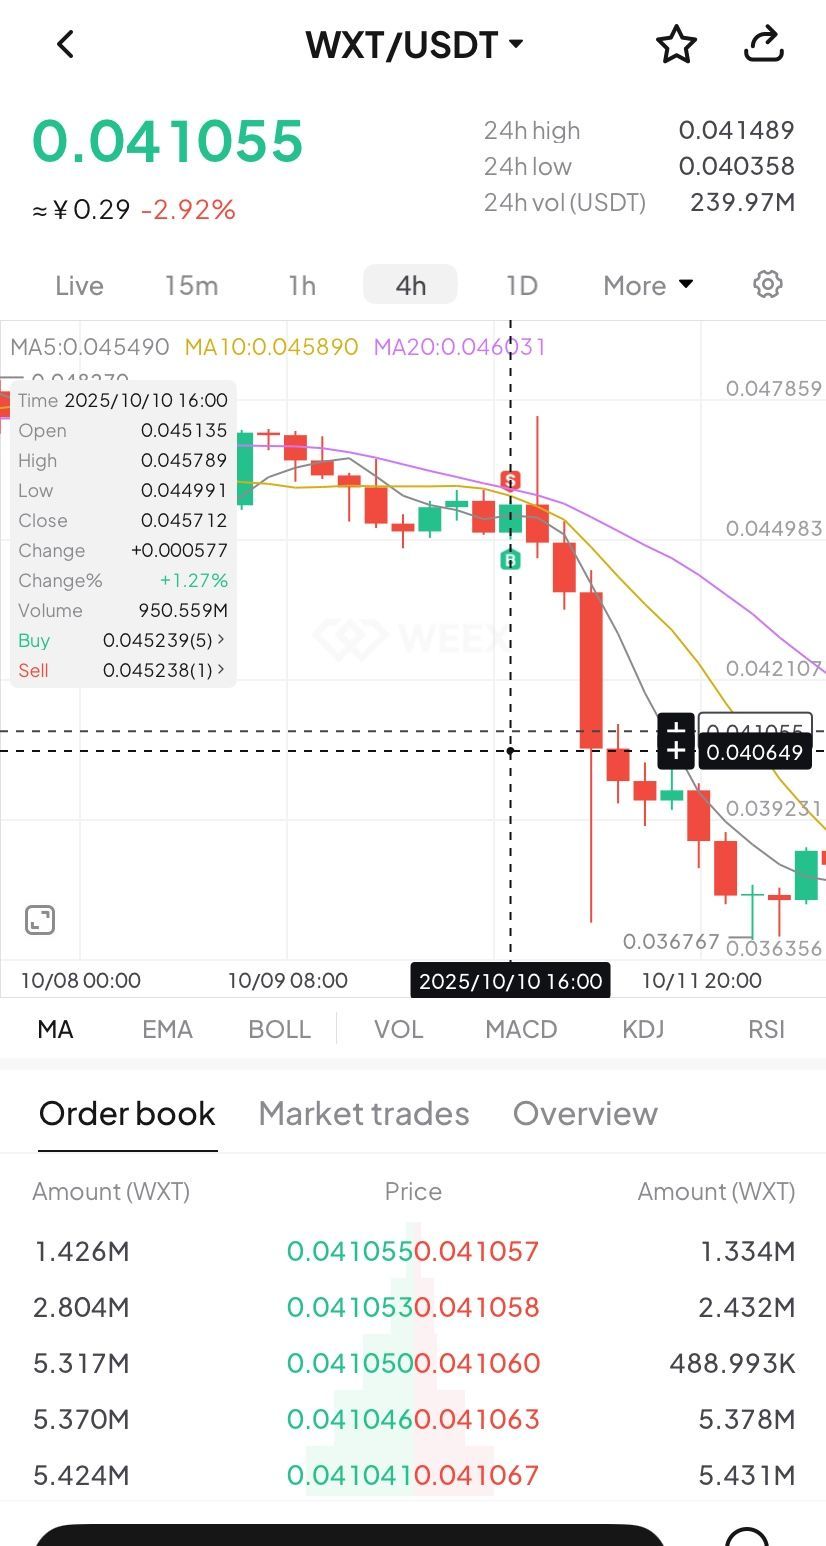
- Your Buy (B) and Sell (S) points are automatically marked on the chart.
- Each marker shows your precise trade time and price, helping you review past orders at a glance.
- Comprehensive coverage
- Spot trading: Full support for marking trades across all spot pairs.
- Futures trading: Clearly shows open and close points, distinguishing between long and short positions.
- Rich interactions
- Tap any marker (B or S) to view detailed trade information, such as:
- Trade time: Review exact trade times and corresponding market conditions.
- Execution price: Displays the average filled price of historical trades.
- Trade count: Quickly check the number of trades in a certain period.
- Markers update dynamically as you zoom and drag the candlestick. Seamlessly review up to 100 executed trades from the last 90 days.
- Universal access
- Available on both iOS and Android: Access your trade history anytime, on any mobile device.
- Full currency coverage: Supports all pairs in your portfolio, across both spot and futures markets.
How to Use?
- Open the WEEX app and go to any pair's chart page.
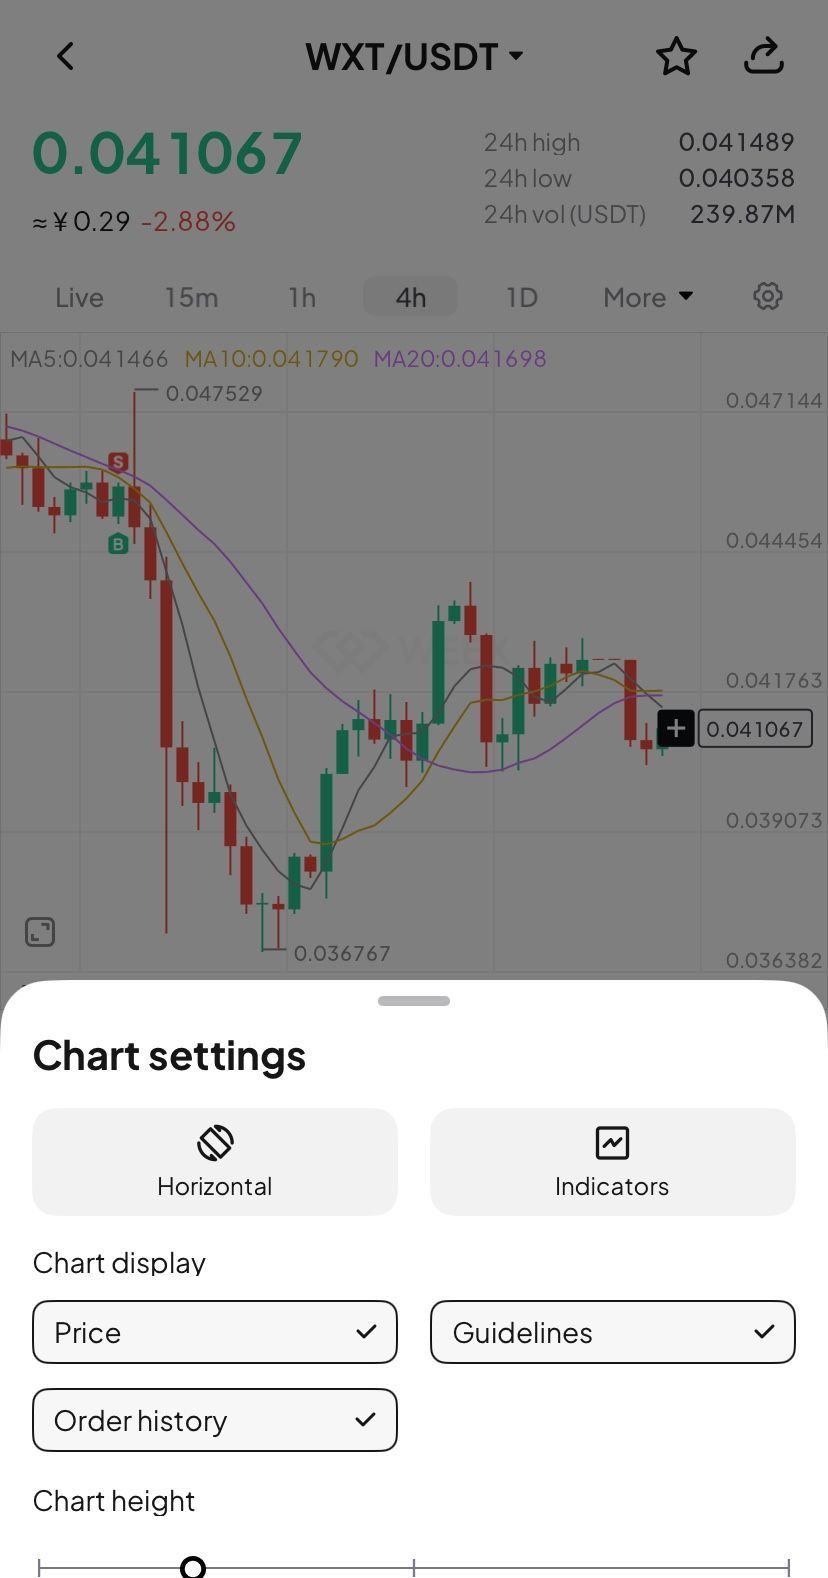
- Tap the candlestick chart and enable the "Order history" feature in the chart settings (enabled by default.)
- If trades exist for that pair, B and S markers will instantly show up on the chart.
- Tap any marker to check the full details of that transaction.
Where to use it
- Review strategies: Quickly review your buy and sell points combined with market trends to refine your strategy.
- Analyze PnL: Easily pinpoint profitable or losing trades to learn from your past performance.
Understand trends: Combine your trade history with the candlestick chart data for deeper market and behavioral analysis.
Feature preview
- On/off toggle: Use the "Settings" icon to switch the "Order History" feature on or off (enabled by default).
- B (Buy) marker: Green marker showing your exact buy action.
- S (Sell) marker: Red marker identifying every sell transaction.
- Details pop-up: Tapping the marker brings up a card with key data (time, price, and count).
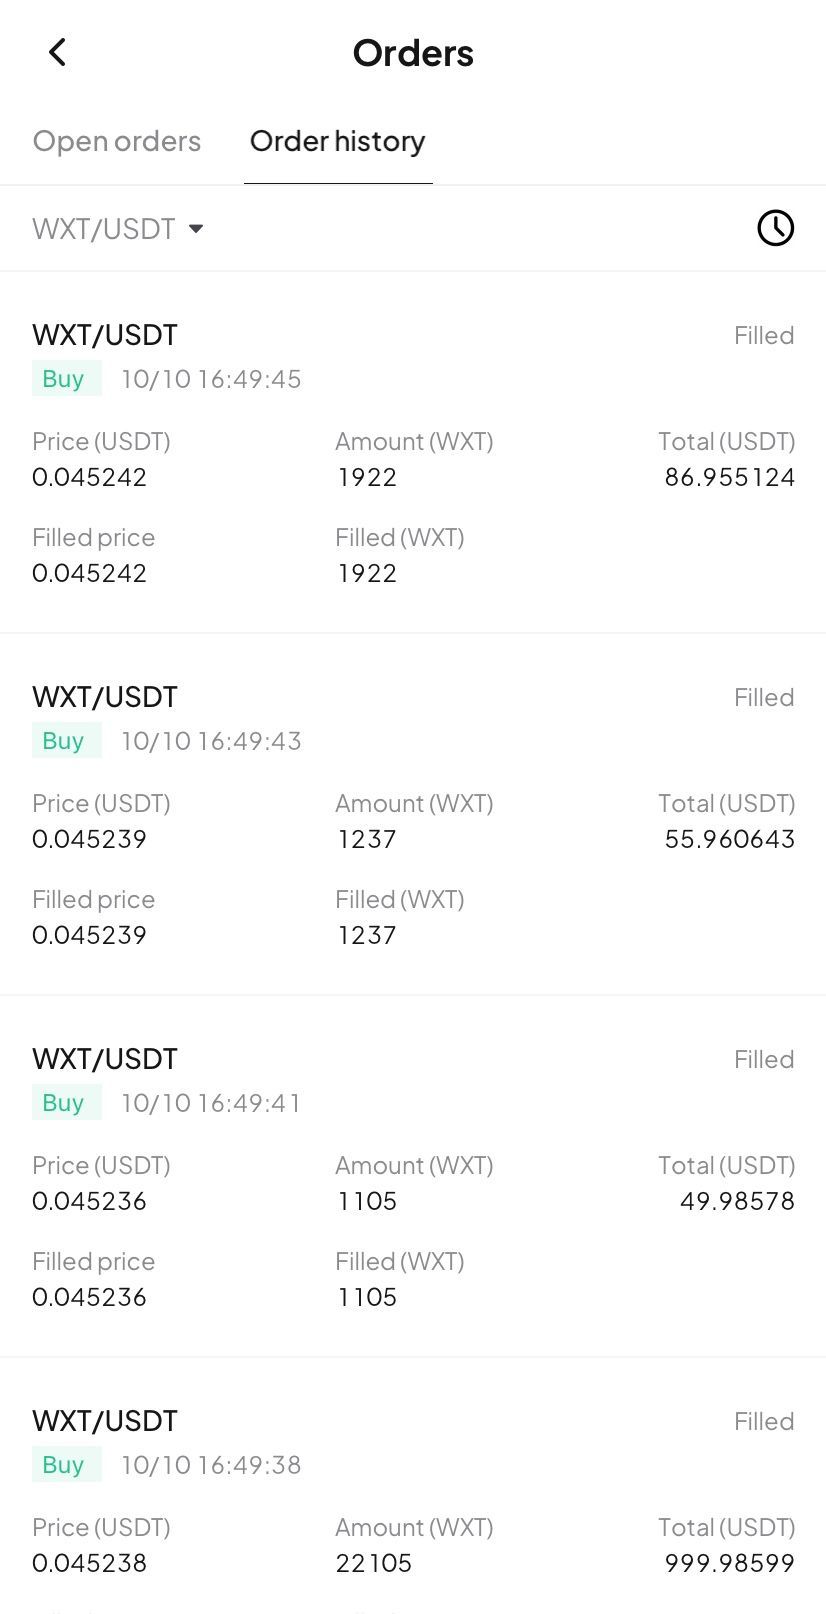
- Full breakdown: Tap the details card to open the "Order History" page and view your trading record.
Try now
Update your WEEX app to the latest version to experience our new Buy/Sell markers! Gain clarity and transparency in your trades, empowering smarter investment decision!
You may also like

Japan’s New Crypto Tax: A Potential Catalyst for Retail Investment Boom
Key Takeaways: Japan’s proposed tax reduction on crypto assets from 55% to 20% is expected to drive a…

Polymarket Gains CFTC Approval for US Trading Platform Operation
Key Takeaways: Polymarket has received approval from the US Commodity Futures Trading Commission (CFTC) to operate as an…

Polymarket’s Regulatory Milestone: A New Era in US Trading Platforms
Key Takeaways Polymarket has gained regulatory approval to operate as an intermediated trading platform in the US. The…

Hong Kong Virtual Asset Trading Platform New Regulation Interpretation (Part 1): "Circular on Shared Liquidity for Virtual Asset Trading Platforms"

Freelancers Beware: How North Korean Operatives Might Be Exploiting Your Skills for Covert Operations
Key Takeaways North Korean operatives are increasingly using freelancers as unwitting proxies to secure remote jobs, bypassing security…

WEEX OTC Lists 200+ Trading Pairs
The WEEX OTC platform now supports 200+ new trading pairs, letting you buy crypto directly with your local currency—quick, simple, and secure.

Malaysia’s Central Bank Launches Three-Year Roadmap for Asset Tokenization Innovation
Key Takeaways Malaysia’s central bank is rolling out a three-year plan to test asset tokenization, focusing on real-world…
Key Market Information Discrepancy on October 27th, a Must-See! | Alpha Morning Report

Megaeth Public Sale, an Airdropless Renaissance

Uncovering the Transferability Blind Spot in Europe’s Digital Asset Regulations
Imagine building a house on shifting sands— that’s a bit like trying to navigate Europe’s rules for digital…

SHIB Encounters $0.000019 Sell Wall as Support Strengthens Around $0.0000178
Shiba Inu (SHIB) enthusiasts are keeping a close eye on the market as the popular meme coin navigates…

WEEX TOKEN2049 Singapore Preview, Feel the Vibes
Themed “Deeper Liquidity , Bigger Whales”, WEEX is stepping up to showcase our cutting-edge trading platform, connect with the brightest minds in the industry, and shape the future of crypto together with YOU.

WEEX at CONF3RENCE Dortmund 2025 Welcome Gala
For WEEX, participating in CONF3RENCE Dortmund marks another important step in its global expansion strategy.
Polymarket Secures Key Regulatory Approval for Triumphant US Return on September 8, 2025
Imagine a world where you could bet on election outcomes or market shifts with the ease of scrolling…
Understanding Crypto Copy Trading: The Future of Effortless Trading
Crypto copy trading has emerged as a popular strategy for many investors entering the world of cryptocurrencies. This…

FTX Launches $5B Creditor Payouts: Essential Insights for 2025
The ongoing FTX creditor payouts are stirring up a mix of debate and excitement, with many wondering if…
Japan’s New Crypto Tax: A Potential Catalyst for Retail Investment Boom
Key Takeaways: Japan’s proposed tax reduction on crypto assets from 55% to 20% is expected to drive a…
Polymarket Gains CFTC Approval for US Trading Platform Operation
Key Takeaways: Polymarket has received approval from the US Commodity Futures Trading Commission (CFTC) to operate as an…
Polymarket’s Regulatory Milestone: A New Era in US Trading Platforms
Key Takeaways Polymarket has gained regulatory approval to operate as an intermediated trading platform in the US. The…
Hong Kong Virtual Asset Trading Platform New Regulation Interpretation (Part 1): "Circular on Shared Liquidity for Virtual Asset Trading Platforms"
Freelancers Beware: How North Korean Operatives Might Be Exploiting Your Skills for Covert Operations
Key Takeaways North Korean operatives are increasingly using freelancers as unwitting proxies to secure remote jobs, bypassing security…
WEEX OTC Lists 200+ Trading Pairs
The WEEX OTC platform now supports 200+ new trading pairs, letting you buy crypto directly with your local currency—quick, simple, and secure.
Popular coins
Latest Crypto News
Customer Support:@weikecs
Business Cooperation:@weikecs
Quant Trading & MM:bd@weex.com
VIP Services:support@weex.com