- Buy Crypto
- Markets
- Futures
- Spot
- Copy Trade
 WE-Launch
Wall Street Continues to Sell Off, How Low Will Bitcoin Go?
During the first week of November, the sentiment in the crypto space was very bearish.
Bitcoin had dropped to a new low below the "10.11" flash crash, failing to hold the $100,000 milestone and even dropping below $99,000, marking a new low for the past six months, while Ethereum hit a low of $3,000.
The total amount of liquidations in the past 24 hours exceeded $2 billion, with long positions losing $1.63 billion and short positions being liquidated for $400 million.
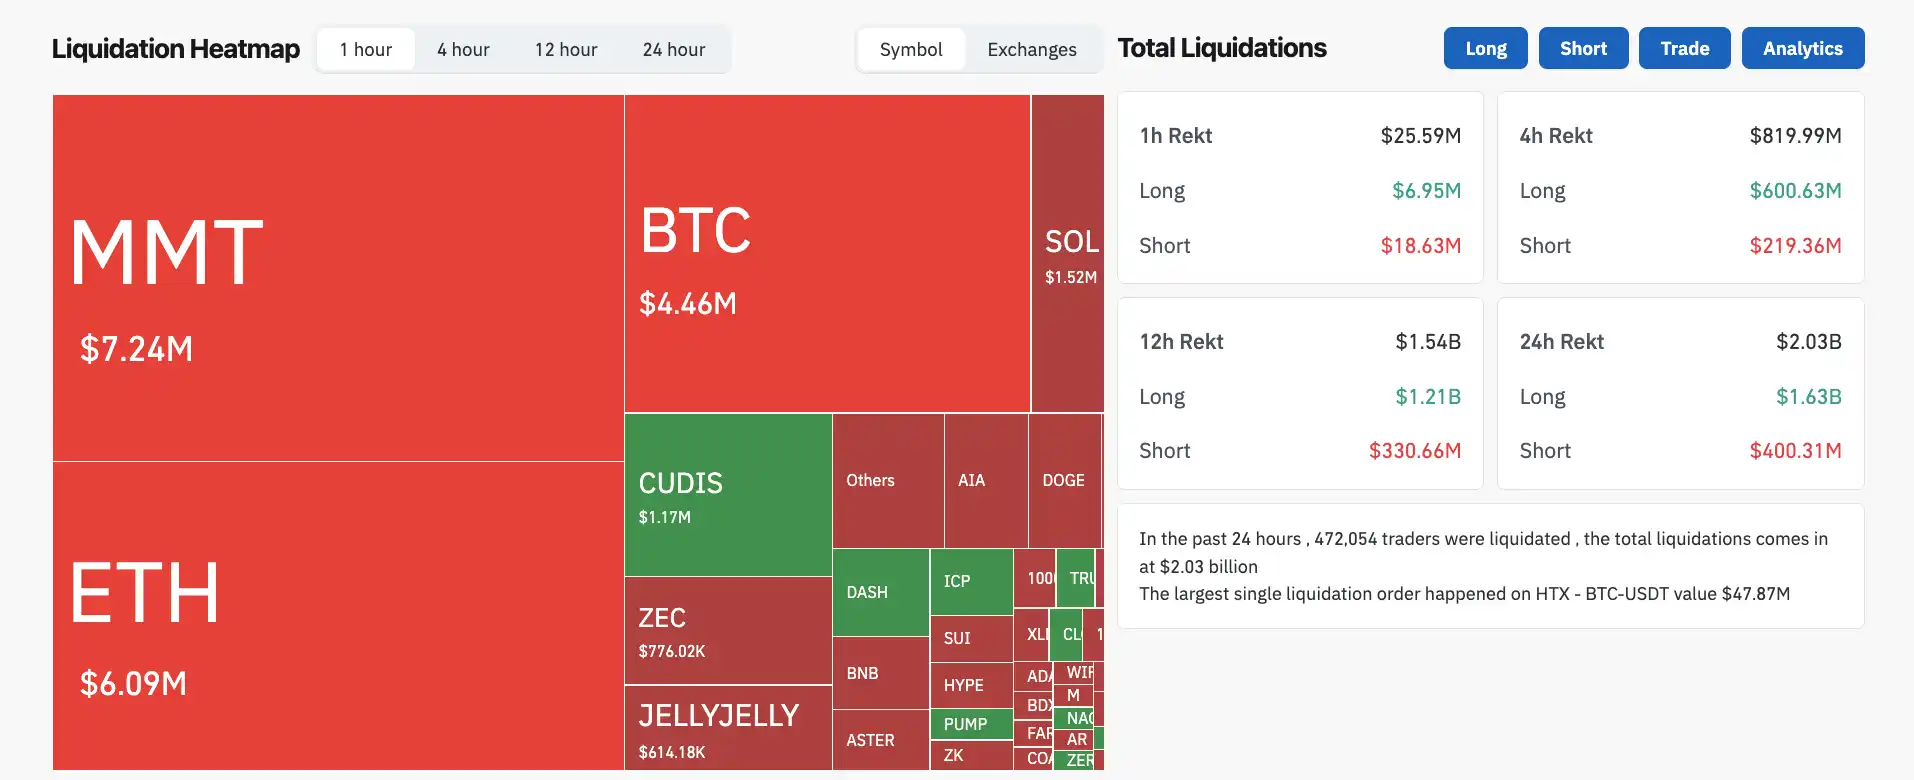
Data Source: CoinGlass
The most tragic event was a long position for BTC-USDT on the HTX trading platform, which was liquidated for $47.87 million, ranking first in the global liquidation list.
There must be some reasons behind the drop, which we will analyze in hindsight.
Industry News
For two consecutive days, there were incidents in the industry. On November 3, the well-known and long-standing DeFi project Balancer was hacked for $116 million due to a code vulnerability. Balancer is part of DeFi infrastructure and is even older than Uniswap, so such a significant code issue has dealt a heavy blow to the industry.
On November 4, a yield farming platform named Stream Finance pulled an exit scam, claiming a loss of $93 million. However, the community is unsure of the cause as the platform did not provide any details, leading to speculation that it was related to the flash crash on "10.11".
The crypto space is so small; we lost another $200 million in just two days.
Macro Perspective
If we take a look at the global capital markets, on November 4, markets worldwide experienced a downturn, including new highs in Japanese and South Korean stocks, as well as pre-market declines in U.S. stocks.
Firstly, there was news of interest rate cuts. In the Fed's speech last Wednesday, the probability of a rate cut in December seemed to have increased once again, indicating that there is no urgent need for a rate cut.
Additionally, there has been a net outflow in ETFs. Last week, Bitcoin's U.S. ETF saw a net outflow of $802 million, followed by another net outflow of $180 million on Monday, November 3rd.
Another event on November 5 is the U.S. Supreme Court holding oral arguments on "tariff trial," examining the legality of Trump's global tariffs. The uncertainty lies in the possibility that if the final ruling goes against Trump, the tariffs may be lifted, leading to further policy adjustments.
The U.S. federal government "shutdown" has entered its 35th day, tying the record for the longest shutdown in U.S. history. The government closure has led institutions to hedge high-risk assets, triggering a sell-off.
Spot ETF Continues to Bleed
The bleeding of ETFs is actually more severe than imagined.
From October 29 to November 3, IBIT, the world's largest Bitcoin spot ETF with a 45% market share owned by BlackRock, saw a cumulative net outflow of $715 million in four trading days, accounting for over half of the total $1.34 billion outflow in the U.S. Bitcoin ETF market.
Looking at the entire week from October 28 to November 3, IBIT saw a net outflow of $403 million, accounting for 50.4% of the market's $799 million outflow, with a single-day outflow of $149 million on October 31, setting a record for the highest daily outflow in the industry.
On November 4, BlackRock's Coinbase Prime custody address also saw on-chain transfers of 2043 BTC and 22,681 ETH, leading the market to speculate that ETF holders were still selling off crypto assets.
Although IBIT's current assets under management remain between $950 million and $1 billion, holding approximately 800,000 BTC (3.8% of the total circulation), the outflow over four days corresponds to around 5,800 BTC, accounting for 0.7% of its holdings.
Despite the relatively small percentage, this is a leading player in the industry, with a significant demonstration effect.
Looking at other major Bitcoin spot ETFs, the top five are BlackRock's IBIT, Fidelity's FBTC, Grayscale's GBTC, Bitwise's BITB, and ARK's collaboration with 21Shares, ARKB.
Fidelity's FBTC saw a net outflow of $180 million during the same period, accounting for 0.7% of its size, which is considered mild. Grayscale's GBTC has seen a slowdown in redemptions after a fee reduction, with outflows of $97 million this week. The relatively smaller BITB and ARKB saw weekly changes around $50 million.
This wave of redemptions is fundamentally a result of a sudden drop in investor risk appetite, in line with macro high interest rate expectations and the Bitcoin technical breakdown.
Even On-Chain Long-Term Holders Are Cashing Out Like Crazy
What's even fiercer than an ETF is actually the OG players on-chain.
Over the past 30 days (October 5 to November 4), those wallet addresses holding coins for over 155 days, commonly known as "Long-Term Holders" (LTH), have collectively sold around 405K BTC, accounting for 2% of the circulation, translating to over $42 billion cashed out based on the average price of $105K during the period.
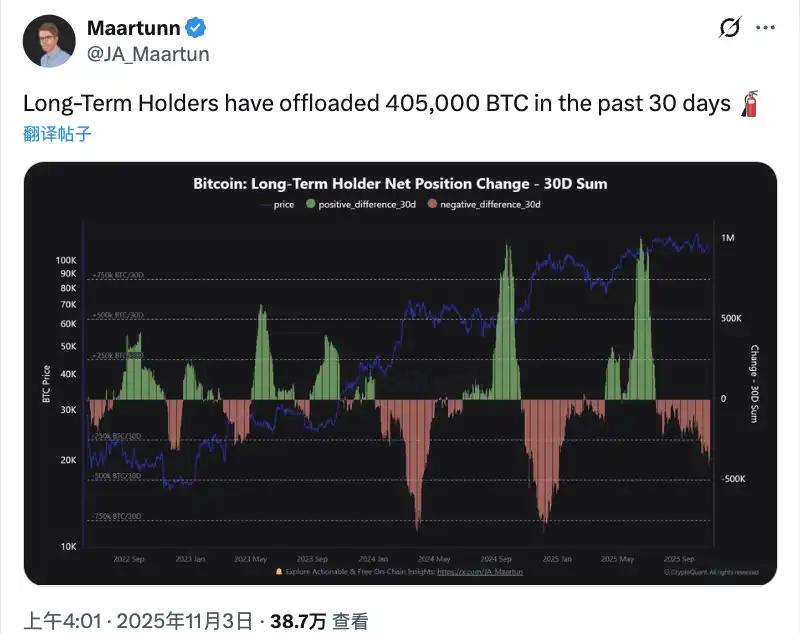
This group of people still holds roughly between 14.4M to 14.6M BTC, representing 74% of the total circulation, and still remains the largest supply side of the market. The issue is that their selling pace perfectly matches the price trend: after Bitcoin hit a historic high of $126K on October 6, profit-taking accelerated significantly; on the "Black Wednesday" (November 10), there was an outflow of 52K BTC in a single day; from late October to early November, combined with four consecutive net outflows from ETFs, daily average sell-offs were all above 18K BTC.
From on-chain data, it can be seen that the main force driving the price down are the wallets holding 10 to 1000 BTC, the "mid-tier holders," who bought in six months to one year ago and are now sitting on around 150% unrealized gains. On the other hand, the whales holding over 1000 BTC are actually slightly increasing their holdings, indicating that the top players are not bearish, and it is only the mid-sized profit-taking holders cashing out.
Comparing historically, in March 2024, LTHs sold 5.05% in a single month, leading to a 16% drop in Bitcoin's price; in December last year, they sold 5.2%, resulting in a 21% drop. This time, the October sell-off was 2.2%, with only a 4% drop, which can be considered relatively mild.
But with both ETF and on-chain bleeding simultaneously, the combination of these two forces is just too much for the market to handle.
Assessment of the Bottom of the Downtrend
Glassnode has published a market observation stating that the market continues to struggle above the short-term holding cost level (around $113K), which is a critical zone for the showdown between bulls and bears. If it fails to reclaim this level, it may further drop to the realized price of active investors (around $88K).
CryptoQuant CEO Ki Young Ju expressed in a series of on-chain data last night that the average cost of Bitcoin wallets is $55.9K, implying that holders are averaging about 93% profit. On-chain capital inflows remain strong. The inability of the price to rise is due to weak demand.
The CEO of 10x Research, Markus Thielen, stated that Bitcoin is approaching the support line since the crash on October 10. If it falls below $107,000, it may test $100,000.
Chinese crypto KOL Ban Mu Xia publicly stated today that "the traditional 4-year cycle bull market has ended, and Bitcoin will gradually fall to $84,000, then experience several months of complex fluctuations, followed by a surge to $240,000 following the stock market bubble in late next year and early the year after."
Currently, the only good news seems to be that historically, Bitcoin has seen an average increase in November.
You may also like

Blockchains Quietly Prepare for Quantum Threat as Bitcoin Debates Timeline
Key Takeaways: Several blockchains, including Ethereum, Solana, and Aptos, are actively preparing for the potential threat posed by…

Three Signs that Bitcoin is Discovering its Market Bottom
Key Takeaways: Indicators suggest the selling pressure on Bitcoin is diminishing, hinting at a potential bottom. With improving…

Trump’s World Liberty Financial Token Ends 2025 Significantly Down
Key Takeaways World Liberty Financial, led by the Trump family, witnessed its token value drop by over 40%…

Former SEC Counsel Explains What It Takes to Make RWAs Compliant
Key Takeaways The SEC’s shifting approach is aiding the growth of Real-World Assets (RWAs), but jurisdictional and yield…

Kraken IPO and M&A Deals to Reignite Crypto’s ‘Mid-Stage’ Cycle
Key Takeaways: Kraken’s upcoming IPO may draw significant interest and capital from traditional finance (TradFi) investors, boosting the…

Extended Crypto ETF Outflows Indicate Institutional Pullback: Glassnode
Key Takeaways: Recent outflows from Bitcoin and Ether ETFs suggest a withdrawal of institutional interest. Institutional disengagement has…

HashKey Secures $250M for New Crypto Fund Amid Strong Institutional Interest
Key Takeaways HashKey Capital successfully secured $250 million for the initial close of its fourth crypto fund, showcasing…

JPMorgan Explores Cryptocurrency Trading for Institutional Clients
Key Takeaways JPMorgan Chase is considering introducing cryptocurrency trading services to its institutional clientele, marking a notable shift…

Trend Research Quietly Becomes One of Ethereum’s Largest Whales with Major ETH Acquisition
Key Takeaways Trend Research has acquired 46,379 ETH, boosting their total holdings to about 580,000 ETH. The company,…
El Salvador’s Bitcoin Dreams Faced Reality in 2025
Key Takeaways El Salvador’s ambitious Bitcoin strategy, introduced in 2021, faced significant challenges and revisions by 2025, particularly…

Price Predictions for 12/22: SPX, DXY, BTC, ETH, BNB, XRP, SOL, DOGE, ADA, BCH
Key Takeaways: Bitcoin’s recovery efforts are met with strong resistance, indicating potential bearish trends at higher levels. Altcoins…

Bitcoin Perpetual Open Interest Surges as Traders Look Forward to Year-End Rally
Key Takeaways Bitcoin perpetual open interest has risen to 310,000 BTC, reflecting a bullish sentiment among traders as…

Aave’s $10M Token Purchase Raises Concerns Over Governance Power
Key Takeaways: Aave founder Stani Kulechov’s $10 million AAVE token purchase sparks debates over governance power concentration. Concerns…
Web3 and DApps in 2026: A Utility-Driven Year for Crypto
Key Takeaways The transition to utility in the crypto sector has set a new path for 2026, emphasizing…

What Happened in Crypto Today: Insights on Bitcoin, IMF, and Ether ETFs
Key Takeaways Anthony Pompliano anticipates a stable Bitcoin price trajectory in the coming year due to its lack…
How to Evaluate a Curator?

Base's 2025 Report Card: Revenue Grows 30X, Solidifies L2 Leadership
From Aave to Ether.fi: Who Captured the Most Value in the On-Chain Credit System?
Blockchains Quietly Prepare for Quantum Threat as Bitcoin Debates Timeline
Key Takeaways: Several blockchains, including Ethereum, Solana, and Aptos, are actively preparing for the potential threat posed by…
Three Signs that Bitcoin is Discovering its Market Bottom
Key Takeaways: Indicators suggest the selling pressure on Bitcoin is diminishing, hinting at a potential bottom. With improving…
Trump’s World Liberty Financial Token Ends 2025 Significantly Down
Key Takeaways World Liberty Financial, led by the Trump family, witnessed its token value drop by over 40%…
Former SEC Counsel Explains What It Takes to Make RWAs Compliant
Key Takeaways The SEC’s shifting approach is aiding the growth of Real-World Assets (RWAs), but jurisdictional and yield…
Kraken IPO and M&A Deals to Reignite Crypto’s ‘Mid-Stage’ Cycle
Key Takeaways: Kraken’s upcoming IPO may draw significant interest and capital from traditional finance (TradFi) investors, boosting the…
Extended Crypto ETF Outflows Indicate Institutional Pullback: Glassnode
Key Takeaways: Recent outflows from Bitcoin and Ether ETFs suggest a withdrawal of institutional interest. Institutional disengagement has…
Popular coins
Latest Crypto News
Customer Support:@weikecs
Business Cooperation:@weikecs
Quant Trading & MM:bd@weex.com
VIP Services:support@weex.com