- Buy Crypto
- Markets
- Futures
- Spot
- Copy Trade
 Earn
Earn- More
BTC Price Poised for Breakout as Volatility Hits 10-Month Low—Here’s What’s Next
You may also like

All-In Podcast Deep Dive: What Money-Making Opportunities Did the Four Silicon Valley Billionaires See in 2026?

Trump Reignites Tariff Storm, Cryptocurrency Market Faces Another 'Black Monday'

Key Market Information Discrepancy on January 19th - A Must-Read! | Alpha Morning Report

Predicting the market does not predict the truth; it simply rewards those who guess right

Delphi Digital's Top 10 Predictions for 2026: Perp DEX Eats Wall Street, AI Agents Usher in Era of Autonomous Trading

X Pulls the Plug — the Era of “Talking Your Way to Traffic” Comes to an End.
Other people’s traffic will always belong to them—not to you.

First Zero, First Revival: A Real Story from the WEEX Global AI Trading Hackathon Preliminary Round
WEEX Labs, the innovation arm of the global crypto exchange WEEX, launched the preliminary round of its flagship AI trading hackathon, AI Wars: WEEX Alpha Awakens, on January 12, 2026. Backed by world-class sponsors including AWS, the prize pool has reached $1.88 million, with a Bentley Bentayga S awaiting the champion in Dubai. Already, 788 elite teams worldwide are battling for a spot in the finals. This is more than a hackathon — it is a real-market stress test for AI trading. Registration remains open until January 18. If you want your AI to face real volatility, this is your moment.
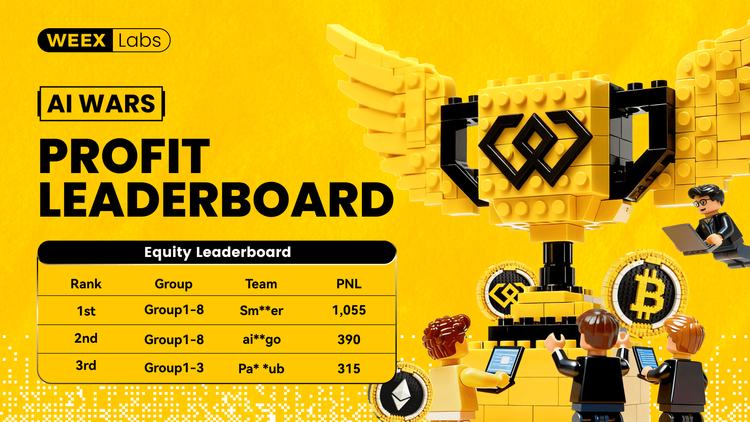
AI Wars: WEEX Alpha Awakens – Insights, Top Strategies, and Real-Market Execution Takeaways
WEEX Labs has officially launched the preliminary round of its global AI trading hackathon, AI Wars: WEEX Alpha Awakens, bringing together hundreds of elite teams to compete in real-market conditions. With a record-breaking $1.88 million prize pool and backing from top-tier sponsors like AWS, the event has quickly become a global proving ground for AI-powered trading strategies. As competition intensifies and standout teams emerge on the leaderboard, the hackathon not only showcases cutting-edge AI execution and risk management, but also offers valuable insights and inspiration for traders looking to build or refine their own AI-driven systems.

WEEX P2P now supports Polish zloty (PLN)—new users and merchant rewards
To make crypto deposits easier, WEEX has officially launched its P2P trading platform and continues to expand fiat support. We're excited to announce that the Polish Zloty (PLN) is now available on WEEX P2P!

Layoffs of 30%, But Spending $250 Million to Buy a Company - What Is Polygon Thinking?

Sentient Reveals Tokenomics, How Will the Market Price It?

AI in the Crypto Market: How Artificial Intelligence is Changing Trading Strategies
This article explores how AI contributes to these movements and share practical strategies to help you navigate an AI-powered crypto market.
Yen Weakness Nears Inflation Red Line: Bank of Japan May Be Forced to Hike Early

Cross-chain Collaboration: Tom Lee Invests $200 Million, Joins Forces with Global Top Streamer Mr. Beast

Interactive Brokers Integrates USDC, US Bank Questions Stablecoin, What's the Overseas Buzz?

Trump Waves Hand, Stirs Venezuela's Game Hurricane
The Genius Stopping Law: Why Did Coinbase Backpedal at the Eleventh Hour?

Fact Check: How Much Money Did the University of Chicago Lose in its Crypto Investment?
All-In Podcast Deep Dive: What Money-Making Opportunities Did the Four Silicon Valley Billionaires See in 2026?
Trump Reignites Tariff Storm, Cryptocurrency Market Faces Another 'Black Monday'
Key Market Information Discrepancy on January 19th - A Must-Read! | Alpha Morning Report
Predicting the market does not predict the truth; it simply rewards those who guess right
Delphi Digital's Top 10 Predictions for 2026: Perp DEX Eats Wall Street, AI Agents Usher in Era of Autonomous Trading
X Pulls the Plug — the Era of “Talking Your Way to Traffic” Comes to an End.
Other people’s traffic will always belong to them—not to you.