- Kripto Al
- Piyasalar
- Vadeli İşlemler
- Spot
- Copy Trade
 Kazan
Kazan- Daha Fazla
Interpreting the on-chain data timestamp: an important basis for judging the transition of the bull market cycle
Original title: "Important basis for judging the transition of the bull market cycle - the timestamp of on-chain data"
Original author: Murphy, on-chain data analyst
There are 2 core concepts in the on-chain data analysis of BTC, namely "timestamp" and "price stamp". The transparency of the blockchain allows us to observe each on-chain transaction and identify two key details: 1. The time when the chip movement occurs: timestamp; 2. The price when the transaction occurs: price stamp;
When we analyze the transition of stage trends, the data used, such as turnover cost, profit realization, demand inflow, hot supply, etc., are mainly based on "price stamp". If we want to observe and analyze the timeliness of the BTC cycle, we need to use "timestamp" more.
Each BTC exists in a certain UTXO, and the timestamp function of UTXO means that each BTC has an age, which does not refer to the time when it was mined, but the time from the last move to the present.
We can distinguish BTCs of different ages by the length of time, for example, they can be divided into 1 week-1 month (1w-1m), or 1-2 years (1-2y), etc. Usually we classify BTCs that have not been moved for more than 6 months (more than 155 days to be precise) or more as long-term holders (LTH) chips, and the rest are classified as short-term holders (STH) chips.
Looking back at the entire development history of BTC, every time there is a bull market cycle, LTH distributes chips to STH; at this time, the proportion of wealth owned by the "old coin group" begins to gradually decline (as shown by the green dotted line in Figure 1);
(Figure 1)
In the bear market, the chips return from STH to LTH, and the proportion of wealth owned by the "new coin group" begins to gradually decline (as shown by the green dotted line in Figure 2);
(Figure 2)
It can be seen that the waveforms in Figure 1 (old coin) and Figure 2 (new coin) are exactly opposite, I call this BTC The "pendulum effect" of the big cycle; the market always follows this endogenous law under the transformation of supply and demand, just like a pendulum, repeating over and over again.
In the large LTH group, the group that has the greatest impact on the cycle transition and even plays a decisive role is the 1-2y and 2-3y coin age chips (diamond hands in the cycle). We can roughly infer the "timestamp" of this round of bull market cycle by observing the changing trend of this data.
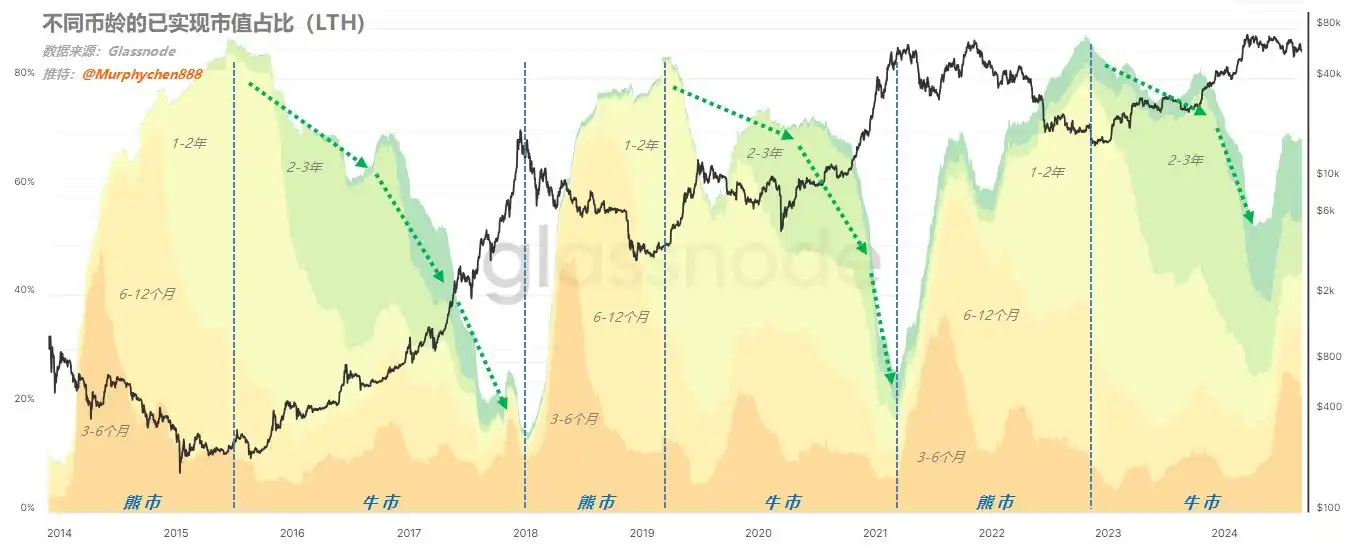
Figure 3 below is the realized market value share data of 1-2y & 2-3y. Let's take a look at the overall situation first. Whenever the yellow (1-2y) and green (2-3y) waveforms reach their peaks, it means that the market is about to exit the bear market and enter the early stages of the bull market. As time goes by, the waveform begins to gradually decline, indicating that the group is distributing chips to new investors entering the market.

(Figure 3)
When the waveform drops to the bottom and the slope begins to slow down, it means that the market is in the middle and late stages of the bull market, which can also be considered the "top range" of the bull market. It should be noted that these two groups are the most experienced investors in the market. For example, the BTC purchased by MSTR three years ago, from December 2021 to January 2022, belongs to this group. When I bought it, it was STH, and today it has become LTH.
The current data has dropped from a peak of 56% to 12.3% (green dotted line in the figure), while the lowest values of the ratio in the previous two cycles were 1.3% (17-18 cycles) and 6.6% (21-22 cycles). Considering that more and more cross-cycle institutional investors like MSTR are joining the coin holding group, I think the lowest value of 1-2y & 2-3y in this cycle should be higher than 6.6% in the previous cycle, and it is expected to be between 7% and 10% with a high probability.
If we draw a standard line based on the current value (point A) (see the red dotted line in Figure 1), we can see that in the first two cycles, when the indicator dropped to the same position, the price of BTC was in the top range, and the relative position was in the middle and late stages of the bull market. As time goes by, the curve gradually hits the bottom and starts to turn upward, and when it returns to the original height again (point B), it usually means that the bull market is over.
From A to B is a "smile curve". The whole process took 17 months in the 17-18 cycle, and 12 months in the 21-22 cycle. According to the above analysis, the bottom of this cycle is likely to be higher than 6.6%. Therefore, I think the total duration of the "smile curve" is less than or equal to 12 months (entering a bear market) is more likely.
At the same time, we can see that in the 17-18 cycle, the time from point A to the last high point of the cycle is 6 months (Figure 3 Mark 1); the time from point A to the last high point of the cycle in the 21-22 cycle is 10 months (Figure 3 Mark 2).
Since the 17-18 cycle is a very special sharp-angled top, it is less referenceable; the 21-22 cycle double top cycle should be more worthy of reference; therefore, I think that the time period from the current point A to the future point B in this cycle is less than/equal to 10 months, perhaps about 9-10 months.
If this inference is true, then the end of this round of bull market cycle will roughly occur between September and October 2025.
Note! All the above probabilistic inferences are only my personal subjective opinions, not objective feedback from data!
After talking about the relationship between currency age conversion and cycle, let's observe from another angle - metaphysics! Three-line co-frequency resonance curve
I roughly counted that the frequency of mentioning the "three-line integration" indicator was the highest in the questions sent to me in the background. Friends seem to be very obsessed with this; although I know that this indicator has shown magical accuracy many times in this cycle, I still think that we should not put the cart before the horse. We should look at the objective data first, and then use the "three lines in one" for reference.

(Figure 4)
Based on the information feedback in the figure, I give the following more subjective interpretations. Friends, please look at it rationally and should not use it as the only basis for judgment!
1. At present, the red line has reached a critical turning point. From the position point of view, the red line is closer to the blue line, and it is a little distance away from the upper green line, and there is no consistency in the adhesion of the three lines.
That is to say, from mid-to-late December to mid-January, there will be 3 possible deviations: continue to break new highs (Figure 4 Mark 1)/consolidation (Figure 4 Mark 2)/pullback (Figure 4 Mark 3); but from the overall trend, the green line and the blue line are both in a pullback state during this stage. Therefore, I personally think that the probability of 3 and 2 is greater than 1;
Emotionally, I prefer 2, and 1 is the least likely; of course, a moderate pullback will also be more conducive to the continuation of this round of trends.
2. Many of you may remember that in my previous analysis of the "three-line integration" indicator, I mentioned: "Around 2024.12-2025.1, MVRV will have a sharp correction." At present, from the comprehensive observation of other on-chain data, this so-called "significant" may not be as big as imagined. There are two reasons:
a. In the current on-chain chip structure distribution, a huge column of 600,000 BTC is formed at $97,000, and there are nearly 2 million BTC accumulation in the 9.4w-10w US dollar range, creating a potential support range.
b. Judging from the current new demand data, although there has been a decline, it has not dropped below the zero axis quickly. In other words, there is still a certain scale of demand in the market, and it can maintain a certain degree of balance.
3. The green and blue lines in the figure are glued at the mark 4, and the glued position is significantly higher than the current (mark 4 in Figure 4), which means that there will be another wave of market in March-April 2025.
According to the current "on-chain average turnover cost" and "active investor average cost" data, I calculated that the price of BTC in March-April has a certain probability of reaching more than 120,000 US dollars, but not more than 150,000 US dollars (since the turnover cost will change, this calculation needs to be calibrated every 2 weeks).
4. If this wave of rebound occurs in March-April, it may be the end of this round of trend market, and the future depends on the changes in macro policies.
5. After this, the market may enter a 4-5 month long consolidation period (as marked 5 in the figure). In the early stage of this stage, the green line and the blue line are consistent and downward; but in the middle, they begin to separate, so there is also great uncertainty here. But in general, the high point of the wide range of consolidation will not exceed the peak of March-April.
6. There will be the last wave of this cycle in September-October 2025 (marked 6 in the figure). At the beginning of this stage, the green line and the blue line are separated greatly. If the red line is close to the blue line at that time, the high point of this wave of market will be higher than the peak of March-April; if the red line is close to the green line, the high point will be lower than the peak of March-April.
At the same time, we can see that the green and blue lines are glued together in the part circled by the red dotted line, and the position here is lower than the peak of March-April. Perhaps it means that the high point of September-October is more likely to be lower than the high point of March-April.
Interestingly, the conclusion of observing the "metaphysical indicator" is highly consistent with the conclusion of the temporal inference of currency age conversion mentioned above. If this is true, it means that the highest point of this cycle will appear in March-April 2025, and the high point in September-October 2025 will be the last "top" of this cycle, and the height may not be higher than the previous one (I personally prefer to be close to the previous high, not necessarily much higher).
From a trading perspective, once entering the top range, I still insist on firmly implementing trading discipline and making a batch profit-taking plan as long as there is a signal of phased attenuation, even if there may be higher highs later (this is a matter of probability). After BTC stops profit, some of the positions vacated may be considered to switch to some high-quality ALTs, and strive to find a second growth curve that outperforms the big cake in the second half of the bull market.
The data shared in this article is only for learning and research, not as investment advice.
Ayrıca bunları da beğenebilirsiniz

Alibaba, Latin Amerika'daki stabilcoin şirketini destekledi. Neden VelaFi?

WEEX AI Ticaret Hackathon'una Katılmak Değer Mi? $1.88M Ödül Havuzu ve Kurallar Açıklandı
$1.88M ödül havuzuna sahip bir AI ticaret yarışması — WEEX AI Ticaret Hackathon kurallarını, OpenAPI ticaretini ve yalnızca AI katılım gereksinimlerini keşfedin.

ABD Senatosu Tarım Komitesi, Kripto Piyasa Yapısının Belirlenmesi İçin 27 Ocak’ı Belirledi
Anahtar Çıkarımlar Senato Tarım Komitesi kripto piyasası yapısına yönelik yasa tasarısını 21 Ocak’ta yayımlayacak ve 27 Ocak’ta görüşme…

Tether 182 Milyon USDT’yi Dondurdu, USDT Tarafsız Bir Kripto Para mı?
Tether, Tron blockchain üzerinde 182 milyon USDT’yi dondurarak önemli bir adım attı; bu durum, stablecoin algısını köklü bir…

Anahtar Piyasa Bilgisi Tutarsızlığı 14 Ocak – Mutlaka Görün! | Alpha Erken Raporu
Bitcoin bu sabah toparlanarak 96.000 doları aştı. Ethereum da 3.300 doları geçti. Gizlilik odaklı coinler ORDI ve SATS…

Base’e Üç Yılını Harcayan Bir Geliştirici
Ana Çıkarımlar Base platformu, “Build on Base. We will support you.” vaatine rağmen, birçok geliştiriciye destek sunmuyor. Yazar…

DeepSeek Kurucusunun Büyüleyici Yolu: Huansquare Quant Fonu Başarıları
Key Takeaways DeepSeek’in kurucusu Liang Wenfeng, Huansquare Quant fonu ile 2025’te %56.55 getiri sağladı. Huansquare Quant, Çin’deki en…

ETHGas Foundation, Reputation Financialization ve Kripto Piyasalarındaki Yeni Gelişmeler
Anahtar Çıkarımlar Zama’nın $ZAMA token satışı, CoinList üzerindeki açık artırma mekanizmasıyla gerçekleştiriliyor ve tartışmalı bir yatırım olarak öne…

XMR Yüzde 50’den Fazla Artış Gösterdi: Kim Satın Alıyor?
XMR (Monero), hem yüksek gizlilik özellikleri hem de son sürat fiyat yükselişi ile kripto para gündeminin üst sırasına…

İlk Kez Üç Yılda Bir Yeni Bitcoin Core Yöneticisi Atandı
Key Takeaways: Bitcoin Core, Bitcoin ana ağı için en önemli geliştirme ve bakım ekibidir. Son üç yılda, yeni…

BitGo’nun Gelirleri ve Dijital Varlık Saklama Hizmetleri Üzerine Derinlemesine Bir Bakış
BitGo, 2025 yılında gelirini 16 milyar dolara çıkarmayı hedeflemekte ve ilk üç çeyrekte yaklaşık 10 milyar dolar gelir…
Analist: MSTR, Bitcoin Boğa Döngüsünün “Mullet”ı olarak Hareket Ediyor ve Bitcoin Baskısı Azaltıyor
Öne Çıkanlar MSTR, Bitcoin’in volatilitesini azaltarak %75’lik bir düşüş yükünü üstlendi. Michael Saylor, büyük miktarda hisse çıkararak piyasa…

Aave DeFi Kredi Piyasası Payı %50’yi Aştı, Mevcut TVL 35.833 Milyar Dolar
Önemli Noktalar Aave, DeFi kredi piyasasında %51,3’lük bir paya ulaştı ve bu oran, 2020’den beri ilk kez bir…

Binance Alpha Empire of Sight Lansmanı: Yenilikler ve Detaylar
Binance Alpha, 14 Ocak’ta saat 16:00’da Empire of Sight (Sight) jetonunu piyasaya sürecek. Airdrop etkinliğine katılım için başlangıçta…
Bugünün Trump Tarifeleri Kararı Bekleniyor, Perakende Satışlar A/A ve PPI Verileri Açıklanacak
Key Takeaways ABD Yüksek Mahkemesi’nin Trump tarifeleri davasıyla ilgili bir karar vermesi bekleniyor. Bu karar, geniş çaplı bir…

Binance Wallet ve Aster İş Birliği: Kolay, Hızlı ve İstikrarlı On-chain Sürekli Sözleşme İşlemleri
Öne Çıkanlar Binance Wallet- Aster İş Birliği: Aster, Binance Wallet’in web versiyonunda sürekli sözleşme işlemlerine olanak tanır. Kullanıcı…
Flashbot Whale “pension-usdt.eth” ETH Long Pozisyonunu Kapatıyor, 4.728M Dolar Kar Ediyor
Önemli Çıkarımlar Flashbot Whale “pension-usdt.eth”, 20.000 ETH uzun pozisyonunu kapatarak 4.728 milyon dolar kar elde etti. ASTER, Hyperliquid…

ASTER’ın Hyperliquid Platformundaki En Büyük Uzun Pozisyonu Büyük Kayıp Yaşıyor
Öne Çıkanlar ASTER’ın Hyperliquid platformunda en büyük uzun pozisyonundaki kayıplar 1.4 milyon dolara ulaştı. 0x6b4 ile başlayan whale…
Alibaba, Latin Amerika'daki stabilcoin şirketini destekledi. Neden VelaFi?
WEEX AI Ticaret Hackathon'una Katılmak Değer Mi? $1.88M Ödül Havuzu ve Kurallar Açıklandı
$1.88M ödül havuzuna sahip bir AI ticaret yarışması — WEEX AI Ticaret Hackathon kurallarını, OpenAPI ticaretini ve yalnızca AI katılım gereksinimlerini keşfedin.
ABD Senatosu Tarım Komitesi, Kripto Piyasa Yapısının Belirlenmesi İçin 27 Ocak’ı Belirledi
Anahtar Çıkarımlar Senato Tarım Komitesi kripto piyasası yapısına yönelik yasa tasarısını 21 Ocak’ta yayımlayacak ve 27 Ocak’ta görüşme…
Tether 182 Milyon USDT’yi Dondurdu, USDT Tarafsız Bir Kripto Para mı?
Tether, Tron blockchain üzerinde 182 milyon USDT’yi dondurarak önemli bir adım attı; bu durum, stablecoin algısını köklü bir…
Anahtar Piyasa Bilgisi Tutarsızlığı 14 Ocak – Mutlaka Görün! | Alpha Erken Raporu
Bitcoin bu sabah toparlanarak 96.000 doları aştı. Ethereum da 3.300 doları geçti. Gizlilik odaklı coinler ORDI ve SATS…
Base’e Üç Yılını Harcayan Bir Geliştirici
Ana Çıkarımlar Base platformu, “Build on Base. We will support you.” vaatine rağmen, birçok geliştiriciye destek sunmuyor. Yazar…