- Buy Crypto
- Markets
- Futures
- Spot
- Copy Trade
 Earn
Earn- More
The market volatility continues. How to determine when the pullback is over?
Original Author: Murphy, On-chain Data Analyst
How to Determine if a Pullback is About to End?
There are many methods to determine if a short-term pullback is about to end. As mentioned before, analysis can be conducted from different perspectives such as chip structure, financial pressure, sentiment feedback, etc. Today, I will share another method that I often use and find very effective, which is to observe the cost basis changes of different time cohorts as a reference point.
Before discussing the logic, let's first look at a case study—the bottom judgment of a large cycle
In Figure 1 below, the blue line represents Long-Term Holder's Average Cost Basis (LTH-RPC), the red line represents Short-Term Holder's Average Cost Basis (STH-RPC), and the black line is BTC's price.
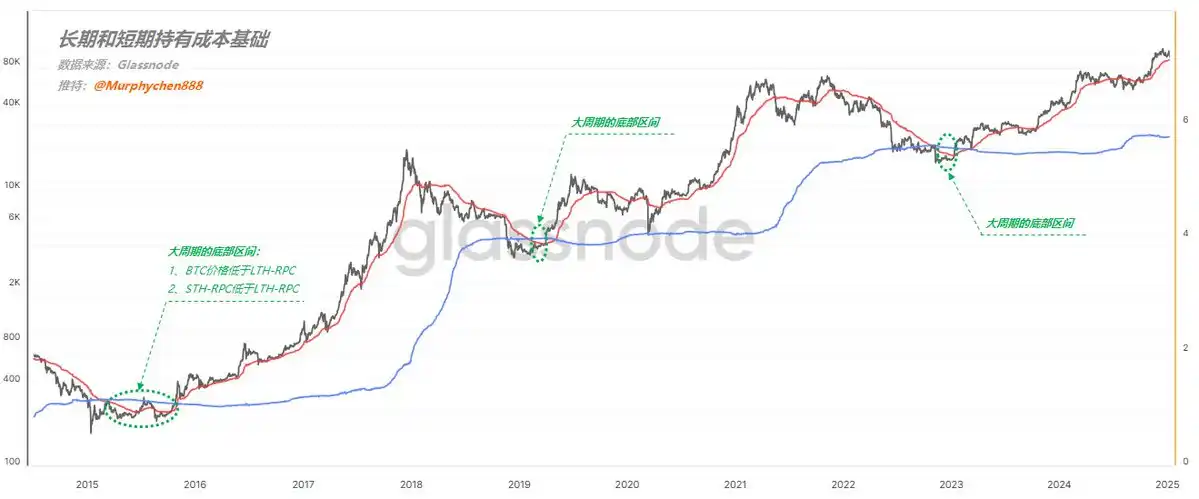
(Figure 1)
Pay attention to the area I have circled in green with a dotted line. As long as the following 2 conditions are met simultaneously:
- Condition 1, BTC price is below LTH-RPC
- Condition 2, STH-RPC is below LTH-RPC
This stage is the bottom range of the large cycle and is also an excellent opportunity to buy the dip!
The underlying logic is as follows:
First, when the BTC price falls below the LTH-RPC, it means that the average cost of long-term holders is at a loss. This indicates that the price is severely undervalued, and the market bubble has almost completely burst.
Second, in the vast majority of time, the longer the chip holding period, the lower the relative cost. Therefore, it is extremely rare for STH-RPC to be lower than LTH-RPC.
It indicates that during the price decline, there were a large number of loss-exiting short-term holders, but new short-term holders entered to buy the dip. After frequent turnover, the cost of short-term chips was actually pulled below the cost of long-term chips. This is a phase of oversold prices, signaling the bottom of the panic sentiment. Following the logic above, we can also apply the same reasoning to determine the duration of a bull market pullback.
Figure 2 below lists the cost bases for: 1d-1w (red line), 1w-1m (yellow line), 1m-3m (blue line), 3m-6m (purple line)

(Figure 2)
First, let's look at February to May 24th, which happens to be the process from the start of a trend to decay and a pullback. The entire process is accompanied by the widening and narrowing of the distance between the blue line and the red line (as indicated by the green arrows in the image);
Eventually, the blue line ran to the top, while the red line was at the bottom, meaning that the relative short-term cost of chips was lower than the relative long-term cost of chips. I call this phenomenon the "reverse arrangement structure" of long-term and short-term costs.
I marked three points in the image with orange dashed lines, all of which show the formation of a blue, yellow, red arrangement from top to bottom, or a purple, blue, yellow, red arrangement, representing the relative bottoms during pullbacks.
So, the current trend is also transitioning from rapid expansion to gradual contraction, but the blue line is still below. If we are to see a market restart in the short term, perhaps a "reverse arrangement structure" needs to be formed first. However, after this period of turnover, the blue line is already very close to the red and yellow 2 lines. As long as there is another period of consolidation, the structure can form, thereby meeting the conditions for forming a relative bottom.
PS: Of course, it would be best to form a purple, blue, yellow, red "reverse arrangement structure," but this would require a longer turnover time (at least 4-5 months).
Summary:
Based on the change in the cost base of different time groups as the basis for judging the time of a pullback, the higher the relative cost of long-term chips, the closer we are to the bottom once a blue, yellow, red "reverse arrangement structure" is formed from top to bottom. This indicates that turnover is sufficient, sentiment is close to the bottom, and the pullback time is coming to an end.
The content shared in this article is for communication and research purposes only and should not be construed as investment advice.
You may also like
$COIN Joins S&P 500, but Coinbase Isn't Celebrating
On May 13, S&P Dow Jones Indices announced that Coinbase would officially replace Discover Financial Services in the S&P 500 on May 19. While other companies like Block and MicroStrategy, closely tied to Bitcoin, were already part of the S&P 500, Coinbase became the first cryptocurrency exchange whose primary business is in the index. This also signifies that cryptocurrency is gradually moving from the fringes to the mainstream in the U.S.
On the day of the announcement, Coinbase's stock price surged by 23%, surpassing the $250 mark. However, just 3 days later, Coinbase was hit by two consecutive events: a hack where employees were bribed to steal customer data and a demand for a $20 million ransom, and an investigation by the U.S. Securities and Exchange Commission (SEC) into the authenticity of its claim of having over 100 million "verified users" in its securities filings and marketing materials. These two events acted as mini-bombs, and at the time of writing, Coinbase's stock had already dropped by over 7.3%.
Coincidentally, Discover Financial Services, being replaced by Coinbase, can also be considered the "Coinbase" of the previous payment era. Discover is a U.S.-based digital banking and payment services company headquartered in Illinois, founded in 1960. Its payment network, Discover Network, is the fourth largest payment network apart from Visa, Mastercard, and American Express.
In April, after the approval of the acquisition of Discover by the sixth-largest U.S. bank, Capital One, this well-established digital banking company of over 60 years smoothly handed over its S&P 500 "seat" to this emerging cryptocurrency "bank." This unexpected coincidence also portrayed the handover between the new and old eras in Coinbase's entry into the S&P 500, resembling a relay race scene. However, this relay baton also brought Coinbase's accumulated "external troubles and internal strife" to a tipping point.
Over the past decade, cryptocurrency exchanges have been the most stable "profit machines." They play a role in providing liquidity to the entire industry and rely on trading fees to sustain their operations. However, with the comprehensive rollout of ETF products in the U.S. market, this profit model is facing unprecedented challenges. As the leader in the "American stack," with over 80% of its business coming from the U.S., Coinbase is most affected by this.
Starting from the approval of Bitcoin and Ethereum spot ETFs, traditional financial capital has significantly onboarded users and funds that originally belonged to exchanges in a more cost-effective, compliant, and transparent manner. The transaction fee revenue of cryptocurrency exchanges has started to decline, and this trend may further intensify in the coming months.
According to Coinbase's 2024 Q4 financial report, the platform's total trading revenue was $417 million, a 45% year-on-year decrease. The contribution of BTC and ETH's trading revenue dropped from 65% in the same period last year to less than 50%.
This decline is not a result of a decrease in market enthusiasm. In fact, since the approval of the Bitcoin ETF in January 2024, the inflow of BTC into the U.S. market has continued to reach new highs, with asset management giants like BlackRock and Fidelity rapidly expanding their management scale. Data shows that BlackRock's iShares Bitcoin ETF (IBIT) alone has surpassed $17 billion in assets under management. As of mid-May 2025, the cumulative net inflow of 11 major institutional Bitcoin spot ETFs on the market has exceeded $41.5 billion, with a total net asset value of $1214.69 billion, accounting for approximately 5.91% of the total Bitcoin market capitalization.
Institutional investors and some retail investors are shifting towards ETF products, partly due to compliance and tax considerations. On one hand, ETFs have much lower trading costs compared to cryptocurrency exchanges. While Coinbase's spot trading fee rate varies annually in a tiered manner but averages around 1.49%, for example, the management fee for IBIT ETF is only 0.25%, and the majority of ETF institution fees fluctuate around 0.15% to 0.25%.
In other words, the more rational users are, the more likely they are to move from exchanges to ETF products, especially for investors aiming for long-term holdings.
According to multiple sources, several institutions, including VanEck and Grayscale, have submitted applications to the SEC for a Solana (SOL) ETF, with some institutions also planning to submit an XRP ETF proposal. Once approved, this may trigger a new round of fund migration. According to a report submitted by Coinbase to the SEC, as of April, the platform's trading revenue from XRP and Solana accounted for 18% and 10%, nearly one-third of the platform's fee revenue.
However, the Bitcoin and Ethereum ETFs passed in 2024 also reduced the fees for these two tokens on Coinbase from 30% and 15% to 26% and 10%, respectively. If the SOL and XRP ETFs are approved, it will further undermine the core fee revenue of exchanges like Coinbase.
The expansion of ETF products is gradually weakening the financial intermediary status of cryptocurrency exchanges. From their original roles as matchmakers and clearers to now gradually becoming mere "on-ramps and off-ramps" for funds, exchanges are seeing their marginal value squeezed by ETFs.
On May 12, 2025, SEC Chairman Paul S. Atkins gave a keynote speech at the Tokenization and Cryptocurrency Working Group roundtable. The theme of his speech revolved around "It is a new day at the SEC," where he indicated that the SEC would not approach enforcement and regulation the same way as before but would instead pave the way for cryptocurrency assets in the U.S. market.
With signs of cryptocurrency compliance such as the SEC's "NEW DAY" declaration, an increasing number of traditional brokerages are attempting to enter the cryptocurrency industry. One of the most representative cases is the well-known U.S. brokerage Robinhood, which began expanding its crypto business in 2018. By the time of its IPO in 2021, Robinhood's crypto business revenue accounted for over 50% of the company, with a significant boost from the Dogecoin "moonshot" promoted by Musk.
In Q1 2025 earnings report, Robinhood showcased strong growth, especially in revenue from cryptocurrency and options trading. Fueled by Trump's Memecoin, cryptocurrency-related revenue reached $250 million, nearly doubling year-over-year. Consequently, Robinhood Gold subscription users reached 3.5 million, a 90% increase from the previous year, with the rapid growth of Robinhood Gold providing the company with a stable source of income.
Meanwhile, RobinHood is actively pursuing acquisitions in the cryptocurrency space. In 2024, it announced a $2 billion acquisition of the long-standing European cryptocurrency exchange Bitstamp. Additionally, Canada's largest cryptocurrency CEX, WonderFi, which recently went public on the Toronto Stock Exchange, also announced its integration with RobinHood Crypto. After obtaining virtual asset licenses in the UK, Canada, Singapore, and other markets, RobinHood has taken a proactive approach in the compliant cryptocurrency trading market.
Furthermore, an increasing number of brokerage firms are exploring the same path. Futu Securities, Tiger Brokers, and others are also dipping their toes into cryptocurrency trading, with some having applied for or obtained the VA license from the Hong Kong SFC. Although their user bases are currently small, traditional brokerages have a natural advantage in user trust, regulatory licenses, and low fee structures. This could pose a threat to native cryptocurrency platforms in the future.
In April 2025, security researchers discovered that some Coinbase user data was leaked on the dark web. While the platform initially responded by attributing it to a "technical misinformation," it still raised concerns among users regarding its security and privacy protection. Just two days before Dow Jones Indexes announced Coinbase's addition to the S&P 500 Index, on May 11, 2025, Coinbase received an email from an unknown threat actor claiming to have obtained customer account information and internal documents, demanding a $20 million ransom to keep the data private. Subsequent investigations confirmed the data breach.
Cybercriminals obtained the data by bribing overseas customer service agents and support staff, mainly in "non-U.S. regions such as India." These agents abused their access to Coinbase's internal customer support system and stole customer data. As early as February this year, blockchain detective ZachXBT revealed on X platform that between December 2024 and January 2025, Coinbase users lost over $65 million to social engineering scams, with the actual amount potentially higher.
Among the victims was a well-known figure, 67-year-old Ed Suman, an established artist in the art world for nearly two decades, having been involved in the creation of artworks such as Jeff Koons' "Balloon Dog" sculpture. Earlier this year, he fell victim to an impersonation scam involving fake Coinbase customer support, resulting in a loss of over $2 million in cryptocurrency. ZachXBT critiqued Coinbase for its inadequate handling of such scams, noting that other major exchanges have not faced similar issues and recommending Coinbase to enhance its security measures.
Amidst a series of ongoing social engineering incidents, although there has not been any impact on user assets at the technical level so far, it has raised concerns among many retail and institutional investors. Especially institutions holding massive assets on Coinbase. Just considering the U.S. BTC ETF institutions, as of mid-May 2025, they collectively hold nearly 840,000 BTC, and 75% of these are custodied by Coinbase. If we price BTC at $100,000, this amount reaches a staggering $63 billion, which is equivalent to the nominal GDP of two Iceland in the year 2024.
In addition, Coinbase Custody also serves over 300 institutional clients, including hedge funds, family offices, pension funds, and endowments. As of the Q1 2025 financial report, Coinbase's total assets under management (including institutional and retail clients) reached $404 billion. The specific amount of institutional custodied assets was not explicitly disclosed in the latest report, but it should still be over 50% based on the Q4 2024 report.
Once this security barrier is breached, not only could the rate of user attrition far exceed expectations, but more importantly, institutional trust in it would undermine the foundation of its business. Therefore, after a hacking event, Coinbase's stock price plummeted significantly.
Facing a decline in spot trading fee revenue, Coinbase is also accelerating its transformation, attempting to find growth opportunities in derivatives and emerging assets. Coinbase acquired a stake in the options platform Deribit at the end of 2024 and announced the official launch of perpetual contract products in 2025. This acquisition fills in Coinbase's gap in options trading and its relatively small global market share.
Deribit has a strong presence in non-U.S. markets, especially in Asia and Europe. The acquisition has enabled Coinbase to gain a dominant position in bitcoin and ethereum options trading on Deribit, accounting for approximately 80% of the global options trading volume, with daily trading volume remaining above $2 billion.
Meanwhile, 80-90% of Deribit's customer base consists of institutional investors, with their professionalism and liquidity in the Bitcoin and Ethereum options market highly favored by institutions. Coinbase's compliance advantage, coupled with its already robust institutional ecosystem, makes it even more suitable. By using institutions as an entry point, it can face the squeeze from giants like Binance and OKX in the derivatives market.
Facing a similar dilemma is Kraken, which is attempting to replicate Binance Futures' model in non-U.S. markets. Since the derivatives market relies more on professional users, fee rates are relatively higher and stickiness is stronger, making it a significant source of revenue for exchanges. In the first half of 2025, Kraken completed the acquisition of TradeStation Crypto and a futures exchange, aiming to build a complete derivatives trading ecosystem to hedge the risk of declining spot transaction fee income.
With the surge of Memecoin in 2024, Binance, OKX, and various CEX platforms began massively listing small-market-cap, highly volatile tokens to activate active trading users. Due to the wealth effect and trading activity of Memecoins, Coinbase was also forced to join the battle, successively listing popular tokens from the Solana ecosystem such as BOOK OF MEME and Dogwifhat. Although these coins are controversial, they are frequently traded, with fee rates several times higher than mainstream coins, serving as a "blood-boosting" method for spot trading.
However, due to its status as a publicly traded company, this practice is a riskier endeavor for Coinbase. Even in the current crypto-friendly environment, the SEC is still investigating whether tokens like SOL, ADA, and SAND constitute securities.
In addition to the forced transformation strategies carried out by the aforementioned CEXs, they are also starting to lay out RWAs and the most talked-about stablecoin payment fields, such as the PYUSD launched through a collaboration between Coinbase and Paypal, Coinbase's support for the Euro stablecoin EURC by Circle that complies with EU MiCA regulatory requirements, or the USD1 launched through a collaboration between Binance and WIFL. In the increasingly crowded trading field, many CEXs have shifted their focus from just the trading market to the application field.
The golden age of transaction fees has quietly ended, and the second half of the crypto exchange platform game has silently begun.
Arthur Hayes: Why I'm Betting on ETH While the Market Is Obsessed with SOL
May 16 Key Market Information Gap, A Must-Read! | Alpha Morning Report
Key Market Intelligence on May 14th, how much did you miss out on?
1.Binance Alpha Launches HIPPO, BLUE, and Other Tokens
2.Believe Ecosystem Tokens See General Rise, LAUNCHCOIN Surges Over 250% in 24 Hours
3.Tiger Securities Introduces Cryptocurrency Deposit and Withdrawal Service, Supports Mainstream Cryptocurrencies such as BTC and ETH
4.Current Bitcoin Rally Possibly Driven by Institutions, Retail Traders Yet to Join
5.Binance Wallet's New TGE Privasea AI Participation Requires a 198 Point Threshold, with a Point Consumption of 15
Source: Overheard on CT (tg: @overheardonct), Kaito
PUMP: Today's discussions about PUMP focus on its new creator revenue-sharing model: the platform will allocate 50% of PumpSwap revenue to token creators, sparking varied reactions from users. Some criticize the move as insufficient or even misleading, while others view it as a positive step the platform is taking to reward creators. Meanwhile, PUMP faces market pressure from emerging competitors like LetsBONKfun and Raydium, which are rapidly gaining market share. Users also express concerns about PUMP's sustainability and potential regulatory risks in the U.S., with discussions extending to the platform's impact on the entire memecoin ecosystem.
COINBASE: Today, Coinbase became the first crypto company to join the S&P 500 Index, replacing Discover Financial Services, sparking widespread industry attention. The entire crypto community views this milestone as a significant development, signaling that crypto assets are further integrating into the mainstream financial system. The news has sparked lively discussions on Twitter, with many users pointing out that this may attract more institutional investors to enter the Bitcoin and other cryptocurrency markets.
XRP: XRP became the focal point of today's crypto discussion, with its significant market movements and strategic advances drawing attention. XRP has surpassed USDT to become the third-largest cryptocurrency by market capitalization, sparking market excitement and discussions about its future potential. The surge in market capitalization and price is believed to be related to increasing institutional interest, deepening strategic partnerships, and its role in the crypto ecosystem. Additionally, XRP's integration into multiple financial systems and its potential as a macro asset class are also seen as key factors driving the current market sentiment.
DYDX: Today's discussions about DYDX mainly focused on the dYdX Yapper Leaderboard launched by KaitoAI. The leaderboard aims to identify the most active community participants, with a total of $150,000 in rewards to be distributed over the first three seasons. This initiative has sparked broad community participation, with many users discussing the potential rewards and the incentive effect on the DYDX ecosystem. Meanwhile, progress on the ethDYDX to dYdX native chain migration and historical airdrop events have also been topics of discussion.
1. "What Is 'ICM'? Holding Up the $4 Billion Market Cap Solana's New Narrative"
Overnight, the hottest narrative in the crypto space has become "Internet Capital Markets," with a host of crypto projects and founders, led by the Solana ecosystem's new Launchpad platform Believe, releasing this phrase. Together with "Believe in something," it has become the new slogan heralding the onset of a bull market. What exactly is the so-called "Internet Capital Market," will it become a short-lived hype phrase like the Base ecosystem's previous Content Coin, and what related targets are available for selection?2.《LaunchCoin Surges 20x in One Day, How Did Believe Create a $200M Market Cap Shiba Inu After Going to Zero?|100x Retrospective》
LAUNCHCOIN broke through a $200 million market cap today, with the long-lost liquidity and such a high market cap "Memecoin" almost bringing half of the on-chain crypto community CT into the fray. The community is crazily discussing this token, with half of it being FOMO and the other half being FUD. This token, originally issued by Believe founder Ben Pasternak under his personal identity, transformed into a new platform token after a renaming. From once going to zero to a $200 million market cap, what happened in between?May 14 On-chain Fund Flow
RWA Evergreen Product Crisis: Why is the GLP Model Doomed to Collapse Under RWA Evergreen?
Week 16 On-Chain Data: Intensifying Structural Supply-Demand Imbalance, Data Reveals Solid Blueprint for Next Bull Run?
Sui Q1 Advanced Report: The Rise of BTCfi Infrastructure, the Boom of Lending Protocols, and the Future of Rollup-Based Scalability
Crypto Developer: The Trump Family's Coin Minting Real Estate Business
SignalPlus Macro Analysis: The Tariff-Torn M2 Narrative and the Return of TradFi-Style FOMO
After El Salvador's President Nayib Bukele signed it, which U.S. states have been **"good, good"** in advancing Bitcoin strategic reserve legislation?
PENGU Experiences Strong Rebound from Bottom with 360% Surge, How Will the Fat Penguin Leverage IP Marketing for a Comeback?
Arthur Hayes Interview: Bitcoin Has Bottomed, Which Tokens Can Outperform Bitcoin?
Ika Receives Strategic Investment from Sui Foundation, Total Funding Exceeds $21 Million
Switzerland Zug, April 28, 2025, Chainwire
The world's fastest parallel MPC network, Ika, is set to launch on the Sui blockchain, announces a strategic investment from the Sui Foundation. Previously, Ika successfully completed a record-breaking 1.4 million SUI NFT art event on Sui. Ika is the world's first sub-second MPC network, capable of achieving zero-trust interoperability among hundreds of signing nodes, unprecedented in scale and rock-solid security.
Ika's core values of performance, speed, and high decentralization align perfectly with Sui. With its upcoming launch on the Sui blockchain, Ika will bring its unparalleled MPC technology into the Sui ecosystem, providing Sui Move smart contract developers with secure cross-Web3 interoperability. This further solidifies Sui's position as the preferred solution in cross-chain DeFi, decentralized custody, chain abstraction, AI-agent defense, native Bitcoin programmability, leveraging the first truly scalable and secure MPC signature scheme.
Ika addresses key bottlenecks of existing MPC networks and delivers unparalleled performance through innovative 2PC-MPC encryption scheme and Sui's Mysticeti consensus protocol:
1. Record Throughput: Ika's transaction processing capability is up to 10,000 times higher than current MPC networks, supporting unprecedented transaction volumes.
2. Ultra-Low Latency: While traditional network signatures may experience delays of 30 seconds or more, Ika can generate signatures in sub-seconds, supporting cross-chain real-time applications.
3. Tremendous Scalability: Ika breaks the conventional limit of 4-8 nodes, and the 2PC-MPC can scale to hundreds or even thousands of signers, enhancing decentralization without sacrificing performance.
4. Zero-Trust Security: Ika's architecture ensures that even in the most extreme scenarios, user assets remain secure, setting a new standard for decentralized security.
Ika's ultra-fast MPC network supports various applications on the Sui blockchain, and several Sui developers have utilized Ika to build tech, including:
· DeFi Interoperability: Ika's sub-second speed and scalability enable instant secure operations within the Web3 ecosystem, bringing liquidity from chains like Bitcoin and Ethereum into Sui. Sui developers Full Sail and Rhei have announced upcoming tech launches based on Ika.
· Decentralized Custody: Ika provides a secure, decentralized custody solution for digital assets on Sui, delivering unparalleled security for both institutional and individual users. Sui developers Aeon and Human Tech have announced the integration of Ika into their technology.
· Chain Abstraction: Ika helps Sui developers abstract away multi-chain complexity for users, combining with Sui's zkLogin feature to deliver a seamless user experience. Sui developers Covault and Lucky Kat have announced the integration of Ika into their technology.
· Programmable Bitcoin: Ika unlocks new possibilities for native BTC on Sui, enabling programmable and secure DeFi and custody. Sui developers Native and Nativerse have announced the upcoming launch of Ika-based technology.
· AI Agent Protection: Ika enhances AI applications on Sui by providing secure MPC protection, ensuring AI agents do not possess unrestricted power and safeguarding user asset security. Sui developers Atoma and Ekko have announced the upcoming launch of Ika-based technology.
The strategic investment in Ika by the Sui Foundation underscores Sui's commitment to driving cutting-edge technology for high performance and decentralization. This amplifies the technical synergy within the Sui ecosystem, propelling Sui and Ika to the forefront of the Web3 revolution, jointly advancing the future of secure, scalable, decentralized infrastructure.
Ika has raised over $21 million in funding, with a peak private valuation of $6 billion FDV, backed by support from Sui Foundation, DCG, Big Brain Holdings, Blockchange, Node Capital, Amplify Partners, Liquid2 Ventures, FalconX, Tykhe Block Ventures, Lightshift, Token Bay Capital, Collider, Zero Knowledge Ventures, NoLimit Holdings, Rubik Ventures, Dispersion Capital, Insignius Capital, Impatient Ventures, Cerulean Ventures, Earl Grey Capital, HDI Ventures, Flowdesk, TPC Ventures, Purechain Capital, Solr DAO, Heroic Ventures, Naval Ravikant, NotVCs, G-20 Group, Artifact Capital, DSRV, Encapsulate, and many other key players in the Web3 space.
Ika also demonstrated the strong support of Sui users by launching the "MF Squid Market" NFT art event, which became the largest and most successful NFT event in Sui's history, raising over 1.4 million SUI and establishing an active grassroots community.
The IKA token is set to native launch on the Sui blockchain, unlocking new decentralized security features and utilities. As the native token of the Ika MPC Network, IKA will play a key role in its ultra-fast, scalable infrastructure, used for paying MPC signature services, enabling seamless transactions within the Web3 ecosystem. Leveraging Sui's unparalleled speed and performance, Ika enhances the security and scalability of the entire ecosystem, introducing the most promising MPC technology in blockchain to the fastest-growing L1 of Web3.
Ika is the world's fastest parallel MPC network, offering sub-second latency, unprecedented scale and decentralization, and zero-trust security. As the preferred choice for interoperability, decentralized custody, and chain abstraction, Ika will fundamentally transform digital asset security and multi-chain DeFi.
Sui is the first Layer 1 blockchain and smart contract platform designed from the ground up to provide fast, private, secure, and inclusive digital assets. Built on the Move programming language, its object-centric model supports parallel execution, sub-second finality, and rich on-chain assets. Through horizontally scalable processing and storage capacity, Sui supports widespread applications at low cost with unparalleled speed. Sui represents a significant advancement in blockchain technology, offering creators and developers a platform to build exceptional user experiences.
Contact:
Ika PR
pr@ika.xyz (mailto:pr@ika.xyz)
Exclusive Interview with AllianceDAO Partner qw: Crypto Entrepreneurs Are Fleeing to AI, 90% of Crypto+AI Projects Are Misleading
Stablecoin Showdown: Six Rising Stars Enter the Fray, Will the Market Structure Shift?
Deep Dive into Dubai's Crypto Dream: Illusion, Capital, and Decentralized Empire
Large companies buying Bitcoin has become a trend, but Asian companies hold less than 1% of the total supply
The "Yearn Finance" Effect: Cryptocurrency Funds Experience the Calm Before the Dawn
$COIN Joins S&P 500, but Coinbase Isn't Celebrating
On May 13, S&P Dow Jones Indices announced that Coinbase would officially replace Discover Financial Services in the S&P 500 on May 19. While other companies like Block and MicroStrategy, closely tied to Bitcoin, were already part of the S&P 500, Coinbase became the first cryptocurrency exchange whose primary business is in the index. This also signifies that cryptocurrency is gradually moving from the fringes to the mainstream in the U.S.
On the day of the announcement, Coinbase's stock price surged by 23%, surpassing the $250 mark. However, just 3 days later, Coinbase was hit by two consecutive events: a hack where employees were bribed to steal customer data and a demand for a $20 million ransom, and an investigation by the U.S. Securities and Exchange Commission (SEC) into the authenticity of its claim of having over 100 million "verified users" in its securities filings and marketing materials. These two events acted as mini-bombs, and at the time of writing, Coinbase's stock had already dropped by over 7.3%.
Coincidentally, Discover Financial Services, being replaced by Coinbase, can also be considered the "Coinbase" of the previous payment era. Discover is a U.S.-based digital banking and payment services company headquartered in Illinois, founded in 1960. Its payment network, Discover Network, is the fourth largest payment network apart from Visa, Mastercard, and American Express.
In April, after the approval of the acquisition of Discover by the sixth-largest U.S. bank, Capital One, this well-established digital banking company of over 60 years smoothly handed over its S&P 500 "seat" to this emerging cryptocurrency "bank." This unexpected coincidence also portrayed the handover between the new and old eras in Coinbase's entry into the S&P 500, resembling a relay race scene. However, this relay baton also brought Coinbase's accumulated "external troubles and internal strife" to a tipping point.
Over the past decade, cryptocurrency exchanges have been the most stable "profit machines." They play a role in providing liquidity to the entire industry and rely on trading fees to sustain their operations. However, with the comprehensive rollout of ETF products in the U.S. market, this profit model is facing unprecedented challenges. As the leader in the "American stack," with over 80% of its business coming from the U.S., Coinbase is most affected by this.
Starting from the approval of Bitcoin and Ethereum spot ETFs, traditional financial capital has significantly onboarded users and funds that originally belonged to exchanges in a more cost-effective, compliant, and transparent manner. The transaction fee revenue of cryptocurrency exchanges has started to decline, and this trend may further intensify in the coming months.
According to Coinbase's 2024 Q4 financial report, the platform's total trading revenue was $417 million, a 45% year-on-year decrease. The contribution of BTC and ETH's trading revenue dropped from 65% in the same period last year to less than 50%.
This decline is not a result of a decrease in market enthusiasm. In fact, since the approval of the Bitcoin ETF in January 2024, the inflow of BTC into the U.S. market has continued to reach new highs, with asset management giants like BlackRock and Fidelity rapidly expanding their management scale. Data shows that BlackRock's iShares Bitcoin ETF (IBIT) alone has surpassed $17 billion in assets under management. As of mid-May 2025, the cumulative net inflow of 11 major institutional Bitcoin spot ETFs on the market has exceeded $41.5 billion, with a total net asset value of $1214.69 billion, accounting for approximately 5.91% of the total Bitcoin market capitalization.
Institutional investors and some retail investors are shifting towards ETF products, partly due to compliance and tax considerations. On one hand, ETFs have much lower trading costs compared to cryptocurrency exchanges. While Coinbase's spot trading fee rate varies annually in a tiered manner but averages around 1.49%, for example, the management fee for IBIT ETF is only 0.25%, and the majority of ETF institution fees fluctuate around 0.15% to 0.25%.
In other words, the more rational users are, the more likely they are to move from exchanges to ETF products, especially for investors aiming for long-term holdings.
According to multiple sources, several institutions, including VanEck and Grayscale, have submitted applications to the SEC for a Solana (SOL) ETF, with some institutions also planning to submit an XRP ETF proposal. Once approved, this may trigger a new round of fund migration. According to a report submitted by Coinbase to the SEC, as of April, the platform's trading revenue from XRP and Solana accounted for 18% and 10%, nearly one-third of the platform's fee revenue.
However, the Bitcoin and Ethereum ETFs passed in 2024 also reduced the fees for these two tokens on Coinbase from 30% and 15% to 26% and 10%, respectively. If the SOL and XRP ETFs are approved, it will further undermine the core fee revenue of exchanges like Coinbase.
The expansion of ETF products is gradually weakening the financial intermediary status of cryptocurrency exchanges. From their original roles as matchmakers and clearers to now gradually becoming mere "on-ramps and off-ramps" for funds, exchanges are seeing their marginal value squeezed by ETFs.
On May 12, 2025, SEC Chairman Paul S. Atkins gave a keynote speech at the Tokenization and Cryptocurrency Working Group roundtable. The theme of his speech revolved around "It is a new day at the SEC," where he indicated that the SEC would not approach enforcement and regulation the same way as before but would instead pave the way for cryptocurrency assets in the U.S. market.
With signs of cryptocurrency compliance such as the SEC's "NEW DAY" declaration, an increasing number of traditional brokerages are attempting to enter the cryptocurrency industry. One of the most representative cases is the well-known U.S. brokerage Robinhood, which began expanding its crypto business in 2018. By the time of its IPO in 2021, Robinhood's crypto business revenue accounted for over 50% of the company, with a significant boost from the Dogecoin "moonshot" promoted by Musk.
In Q1 2025 earnings report, Robinhood showcased strong growth, especially in revenue from cryptocurrency and options trading. Fueled by Trump's Memecoin, cryptocurrency-related revenue reached $250 million, nearly doubling year-over-year. Consequently, Robinhood Gold subscription users reached 3.5 million, a 90% increase from the previous year, with the rapid growth of Robinhood Gold providing the company with a stable source of income.
Meanwhile, RobinHood is actively pursuing acquisitions in the cryptocurrency space. In 2024, it announced a $2 billion acquisition of the long-standing European cryptocurrency exchange Bitstamp. Additionally, Canada's largest cryptocurrency CEX, WonderFi, which recently went public on the Toronto Stock Exchange, also announced its integration with RobinHood Crypto. After obtaining virtual asset licenses in the UK, Canada, Singapore, and other markets, RobinHood has taken a proactive approach in the compliant cryptocurrency trading market.
Furthermore, an increasing number of brokerage firms are exploring the same path. Futu Securities, Tiger Brokers, and others are also dipping their toes into cryptocurrency trading, with some having applied for or obtained the VA license from the Hong Kong SFC. Although their user bases are currently small, traditional brokerages have a natural advantage in user trust, regulatory licenses, and low fee structures. This could pose a threat to native cryptocurrency platforms in the future.
In April 2025, security researchers discovered that some Coinbase user data was leaked on the dark web. While the platform initially responded by attributing it to a "technical misinformation," it still raised concerns among users regarding its security and privacy protection. Just two days before Dow Jones Indexes announced Coinbase's addition to the S&P 500 Index, on May 11, 2025, Coinbase received an email from an unknown threat actor claiming to have obtained customer account information and internal documents, demanding a $20 million ransom to keep the data private. Subsequent investigations confirmed the data breach.
Cybercriminals obtained the data by bribing overseas customer service agents and support staff, mainly in "non-U.S. regions such as India." These agents abused their access to Coinbase's internal customer support system and stole customer data. As early as February this year, blockchain detective ZachXBT revealed on X platform that between December 2024 and January 2025, Coinbase users lost over $65 million to social engineering scams, with the actual amount potentially higher.
Among the victims was a well-known figure, 67-year-old Ed Suman, an established artist in the art world for nearly two decades, having been involved in the creation of artworks such as Jeff Koons' "Balloon Dog" sculpture. Earlier this year, he fell victim to an impersonation scam involving fake Coinbase customer support, resulting in a loss of over $2 million in cryptocurrency. ZachXBT critiqued Coinbase for its inadequate handling of such scams, noting that other major exchanges have not faced similar issues and recommending Coinbase to enhance its security measures.
Amidst a series of ongoing social engineering incidents, although there has not been any impact on user assets at the technical level so far, it has raised concerns among many retail and institutional investors. Especially institutions holding massive assets on Coinbase. Just considering the U.S. BTC ETF institutions, as of mid-May 2025, they collectively hold nearly 840,000 BTC, and 75% of these are custodied by Coinbase. If we price BTC at $100,000, this amount reaches a staggering $63 billion, which is equivalent to the nominal GDP of two Iceland in the year 2024.
In addition, Coinbase Custody also serves over 300 institutional clients, including hedge funds, family offices, pension funds, and endowments. As of the Q1 2025 financial report, Coinbase's total assets under management (including institutional and retail clients) reached $404 billion. The specific amount of institutional custodied assets was not explicitly disclosed in the latest report, but it should still be over 50% based on the Q4 2024 report.
Once this security barrier is breached, not only could the rate of user attrition far exceed expectations, but more importantly, institutional trust in it would undermine the foundation of its business. Therefore, after a hacking event, Coinbase's stock price plummeted significantly.
Facing a decline in spot trading fee revenue, Coinbase is also accelerating its transformation, attempting to find growth opportunities in derivatives and emerging assets. Coinbase acquired a stake in the options platform Deribit at the end of 2024 and announced the official launch of perpetual contract products in 2025. This acquisition fills in Coinbase's gap in options trading and its relatively small global market share.
Deribit has a strong presence in non-U.S. markets, especially in Asia and Europe. The acquisition has enabled Coinbase to gain a dominant position in bitcoin and ethereum options trading on Deribit, accounting for approximately 80% of the global options trading volume, with daily trading volume remaining above $2 billion.
Meanwhile, 80-90% of Deribit's customer base consists of institutional investors, with their professionalism and liquidity in the Bitcoin and Ethereum options market highly favored by institutions. Coinbase's compliance advantage, coupled with its already robust institutional ecosystem, makes it even more suitable. By using institutions as an entry point, it can face the squeeze from giants like Binance and OKX in the derivatives market.
Facing a similar dilemma is Kraken, which is attempting to replicate Binance Futures' model in non-U.S. markets. Since the derivatives market relies more on professional users, fee rates are relatively higher and stickiness is stronger, making it a significant source of revenue for exchanges. In the first half of 2025, Kraken completed the acquisition of TradeStation Crypto and a futures exchange, aiming to build a complete derivatives trading ecosystem to hedge the risk of declining spot transaction fee income.
With the surge of Memecoin in 2024, Binance, OKX, and various CEX platforms began massively listing small-market-cap, highly volatile tokens to activate active trading users. Due to the wealth effect and trading activity of Memecoins, Coinbase was also forced to join the battle, successively listing popular tokens from the Solana ecosystem such as BOOK OF MEME and Dogwifhat. Although these coins are controversial, they are frequently traded, with fee rates several times higher than mainstream coins, serving as a "blood-boosting" method for spot trading.
However, due to its status as a publicly traded company, this practice is a riskier endeavor for Coinbase. Even in the current crypto-friendly environment, the SEC is still investigating whether tokens like SOL, ADA, and SAND constitute securities.
In addition to the forced transformation strategies carried out by the aforementioned CEXs, they are also starting to lay out RWAs and the most talked-about stablecoin payment fields, such as the PYUSD launched through a collaboration between Coinbase and Paypal, Coinbase's support for the Euro stablecoin EURC by Circle that complies with EU MiCA regulatory requirements, or the USD1 launched through a collaboration between Binance and WIFL. In the increasingly crowded trading field, many CEXs have shifted their focus from just the trading market to the application field.
The golden age of transaction fees has quietly ended, and the second half of the crypto exchange platform game has silently begun.
Arthur Hayes: Why I'm Betting on ETH While the Market Is Obsessed with SOL
May 16 Key Market Information Gap, A Must-Read! | Alpha Morning Report
Key Market Intelligence on May 14th, how much did you miss out on?
1.Binance Alpha Launches HIPPO, BLUE, and Other Tokens
2.Believe Ecosystem Tokens See General Rise, LAUNCHCOIN Surges Over 250% in 24 Hours
3.Tiger Securities Introduces Cryptocurrency Deposit and Withdrawal Service, Supports Mainstream Cryptocurrencies such as BTC and ETH
4.Current Bitcoin Rally Possibly Driven by Institutions, Retail Traders Yet to Join
5.Binance Wallet's New TGE Privasea AI Participation Requires a 198 Point Threshold, with a Point Consumption of 15
Source: Overheard on CT (tg: @overheardonct), Kaito
PUMP: Today's discussions about PUMP focus on its new creator revenue-sharing model: the platform will allocate 50% of PumpSwap revenue to token creators, sparking varied reactions from users. Some criticize the move as insufficient or even misleading, while others view it as a positive step the platform is taking to reward creators. Meanwhile, PUMP faces market pressure from emerging competitors like LetsBONKfun and Raydium, which are rapidly gaining market share. Users also express concerns about PUMP's sustainability and potential regulatory risks in the U.S., with discussions extending to the platform's impact on the entire memecoin ecosystem.
COINBASE: Today, Coinbase became the first crypto company to join the S&P 500 Index, replacing Discover Financial Services, sparking widespread industry attention. The entire crypto community views this milestone as a significant development, signaling that crypto assets are further integrating into the mainstream financial system. The news has sparked lively discussions on Twitter, with many users pointing out that this may attract more institutional investors to enter the Bitcoin and other cryptocurrency markets.
XRP: XRP became the focal point of today's crypto discussion, with its significant market movements and strategic advances drawing attention. XRP has surpassed USDT to become the third-largest cryptocurrency by market capitalization, sparking market excitement and discussions about its future potential. The surge in market capitalization and price is believed to be related to increasing institutional interest, deepening strategic partnerships, and its role in the crypto ecosystem. Additionally, XRP's integration into multiple financial systems and its potential as a macro asset class are also seen as key factors driving the current market sentiment.
DYDX: Today's discussions about DYDX mainly focused on the dYdX Yapper Leaderboard launched by KaitoAI. The leaderboard aims to identify the most active community participants, with a total of $150,000 in rewards to be distributed over the first three seasons. This initiative has sparked broad community participation, with many users discussing the potential rewards and the incentive effect on the DYDX ecosystem. Meanwhile, progress on the ethDYDX to dYdX native chain migration and historical airdrop events have also been topics of discussion.
1. "What Is 'ICM'? Holding Up the $4 Billion Market Cap Solana's New Narrative"
Overnight, the hottest narrative in the crypto space has become "Internet Capital Markets," with a host of crypto projects and founders, led by the Solana ecosystem's new Launchpad platform Believe, releasing this phrase. Together with "Believe in something," it has become the new slogan heralding the onset of a bull market. What exactly is the so-called "Internet Capital Market," will it become a short-lived hype phrase like the Base ecosystem's previous Content Coin, and what related targets are available for selection?2.《LaunchCoin Surges 20x in One Day, How Did Believe Create a $200M Market Cap Shiba Inu After Going to Zero?|100x Retrospective》
LAUNCHCOIN broke through a $200 million market cap today, with the long-lost liquidity and such a high market cap "Memecoin" almost bringing half of the on-chain crypto community CT into the fray. The community is crazily discussing this token, with half of it being FOMO and the other half being FUD. This token, originally issued by Believe founder Ben Pasternak under his personal identity, transformed into a new platform token after a renaming. From once going to zero to a $200 million market cap, what happened in between?May 14 On-chain Fund Flow